Monday, November 30, 2015

Jersey City's Property Taxes are State's Most Unfair (Is anyone surprised?)

All along, I've had a feeling that Jersey City's property tax apportionment would be New Jersey's most inequitable, based on the 27 year lapse since Jersey City's last reassessment and the fact that parts of Jersey City have seen a resurgence while other parts have been relatively stalled.  What I didn't know until recently is that there is a statistical measure of unfairness in tax apportionment called a "Coefficient of Deviation."

A General Coefficient of Deviation is a measure of variation, i.e. the average deviation of individual Assessment-Sales Ratios from the overall average Assessment-Sales Ratio of all sales in a taxing district expressed as a percent. About 25 years ago a 20 percent General Coefficient of Deviation was considered a good degree of uniformity, the current acceptable figure for Coefficients of Deviation is 15 percent, although some authorities advocate 10 percent in light of improved assessment practices and computerization. A Coefficient of Deviation greater than 15 per-cent indicates a significant lack of uniformity within a municipality and the need for revaluation.
Like a Correlation Coefficient, the Coefficient of Deviation is a measure of the tightness of a cluster.  The tighter the cluster, the more fair the existing property assessment is, since every's property diverges from official valuation by the same ratio.  The looser the cluster, the less fair the existing property assessment is, since different property owners have properties of very different ratios from assessed value and yet all property owners pay taxes on the same outdated assessment.

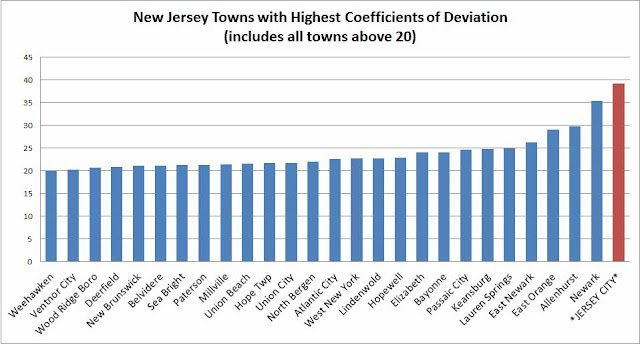
The Department of the Treasury's guideline is that any a town with a Coefficient of Deviation greater than 15% should reassess.  Jersey City's Coefficient of Deviation is 39%, this is the highest in the state of New Jersey, and is virtually an outlier.   The town with the next most unbalanced tax assessment, Newark,  has a Coefficient of Deviation of 35.39% and there is not a third New Jersey town with a Coefficient of Deviation above 30%.  Counting Jersey City and Newark, there are only 27 towns (out of over 560) with Coefficients of Deviation above 20%.

(Source, Department of the Treasury, MEASURES OF PROPERTY ASSESSMENT UNIFORMITY IN NEW JERSEY TAXING DISTRICTS)


Jersey City isn't the only town in New Jersey to have not reassessed since the 1980s and there are some who haven't reassessed since the 1970s.  Although Jersey City has New Jersey's highest Coefficient of Deviation, Jersey City's General Assessment compared to its Equalized Valuation is only the twelfth lowest in New Jersey:


(Source, Table of Equalized Valuations 2016)

However, most of the other towns who are badly underassessed usually do not have high Coefficients of Deviation.  This is because the other non-reassessing towns have seen more uniform growth, with each neighborhood essentially on the same real estate trajectory.  Thus, although several other towns haven't reassessed in decades, their growth has been very uniform and very few taxpayers are being taxed unfairly.  


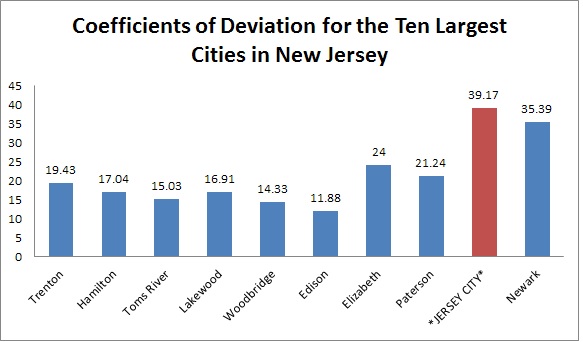
It's easy for a smaller town to have consistent and fair variations, but New Jersey's other largest cities do not show the same shockingly high variation in prices vs assessments that Jersey City has.  


Paterson's recent reassessment offers some hints of what is in store for Jersey City.  

When Paterson reassessed in 2014-15 it had not reassessed since 2007 and had a Coefficient of Deviation of 23.04.  


More than 11,000 Paterson homeowners are paying lower property taxes as a result of this year’s revaluation, according to a report issued this week by city officials.

On the other hand, 5,500 homeowners saw their property tax bills increase because of the new assessments, the report showed.

The disparities of the impact of the revaluation in some instances are substantial. For example, 152 homeowners were hit with annualized tax increases of more than $5,000, while 385 homeowners enjoyed reductions of more than $5,000, the report said.

Many of the people who had the biggest increases in Paterson were people who had filed successful tax appeals.  Many of the people who saw the biggest drops in their property taxes were people who had never filed tax appeals.  

Commercial property in Paterson ended up paying a high share of property taxes after Paterson's reassessment.  It is unclear if that would apply in Jersey City as well.

The Fulop Doctrine:  "If an area was once poor and is now affluent,
that area should continue to pay property taxes as if it were still poor
until I am no longer mayor."
Steve Fulop justified cancelling Jersey City's reassessment this way, "I will not allow this back-door tax hike planned by the Healy administration to take place," although Fulop also accused the reassessment firm (Realty Appraisal Co. of West New York) of using backroom dealing to get the reassessment contract, even though Realty Appraisal had submitted the lowest of four bids.

Steve Fulop himself lives in a house which is more under assessed than average for Jersey City and thus is likely to see a large increase in his personal taxes. 

Fulop's house in the Heights is assessed at $104,000. Thus, at Jersey City's 7.434 tax rate (2014), Steve Fulop pays about $7,700 in property taxes.  However, Fulop bought his house in 2015 for $845,000. If Mayor Fulop's own house is reassessed at its $845,000 market value as part of a city-wide reassessment and Jersey City's official tax rate equaled its Effective Tax Rate (aka, Equalized Tax Rate) of 2.219, then Steve Fulop would pay at least $19,300, an increase of almost $12,000.  ($19,300 = 2.219% of $845,000.)

$19,300 a year in in property taxes may sound like a lot, but people living in most other New Jersey towns - including most other Abbotts - would pay much more than that.  Someone living in a $845,000 house in Bayonne would pay $27,000.

Fulop's cancellation of Jersey City's long-planned reassessment worries me because it is part of a pattern of tax unfairness.  Fulop has continued his predecessors' aggressive policy of granting PILOTs, even though PILOT residents are allowed to pay $0 to the Jersey City Public Schools.  Also, if Fulop opposed reassessment because it would increase taxes for downtown and waterfront property owners, then, by the same logic, he could oppose redistributing state aid because that would mean increased taxes for aid-losing districts.  

As Mayor of Jersey City, Steve Fulop is supposed to govern in the interest of the entire city, but in cancelling reassessment Fulop was governing in the interest of downtown and the waterfront.  I do not think this bodes well for Fulop being a fair-minded, impartial governor.  


Friday, November 27, 2015

New Graphs for Old Posts: Part 2

Hi, these are some new graphs I've added to old posts.

The graphs contain information I either didn't put together or didn't have when I wrote the original posts.

1.  Abbott/Bacon Comparisons

These graphs compare FRL-eligibility and Local Fair Share per student in the Abbott districts and Bacon districts.

The point is to underscore that the Bacon districts are NOT rural equivalents of the Abbotts.  The Bacons are poorer than average, but as a class they are not even remotely the poorest in New Jersey.


2.  Jersey City Pre-K Cost Growth

This is an addition to my post "Jersey City's Development Boom, Pre-K, and the Aid Cuts Coming Your Way."

The post was about the increasing difficulty the state will be under in fulfilling the Supreme Court's mandate that all children in the ABbotts get two years of state-funded Pre-K.

Jersey City's Pre-K population is expected to grow by 25% in only five years due to Jersey City's building boom.  This will probably cost the state $30 million.

K-12 state aid is expected to be stagnant, so the money for Jersey City's "free" Pre-K will have to be taken from other districts.

Anyway, this graph shows the cost growth of JC's Pre-K since 2007-08 and compares it to K-12 state aid.


3.  Contrasting Construction Cost Sharing between Abbotts and non-Abbotts


With few exceptions, the Abbott districts pay 0% of construction costs.  

The amount of money non-Abbotts have to contribute varies.  The SDA (Schools Development Authority) purports to pay for at least 40% of construction costs itself, but there are numerous restrictions on what non-Abbotts can even apply for construction for, so comparing cost sharing between Abbotts and non-Abbotts is not an apples to apples comparison.

Moreover, the amount the SDA pays in non-Abbotts varies.  

However, you can always get a representative snapshot view of construction funding for non-Abbotts.  I found such a snapshot in the April to September 2011 Biannual Report of the SDA

During that time, the SDA supported projects at 108 schools with a TOTAL COST of $105,263,754.  For those projects the local contribution was $56,954,285.  Therefore the local cost sharing for this period was 53%.

Thus, I am adding this chart to compare Abbott and non-Abbott cost sharing.  To avoid any nitpicking about what the local cost share is for non-Abbotts, this charter specifically refers to only the mid-2011 period.


Tuesday, November 24, 2015

More on the Error in the Education Law Center's Report on Adjustment Aid

This is an expansion of a post I wrote a few weeks ago critiquing as misleading the Education Law Center's report "The Facts on Hold Harmless Aid in NJ's School Funding Formula," which is a defense of Adjustment Aid.

Adjustment Aid is legalized aid hoarding.  Adjustment Aid is aid that a district would get if SFRA's aid formulas indicate that it needs less money than it was getting before SFRA became law.  The way Adjustment Aid works is that if SFRA's formulas indicate that the district should get $30 million but it was getting $40 million pre-SFRA, it would still get $40 million total, with $30 million coming in regular formula aid and then $10 million in Adjustment Aid.

Adjustment Aid "hold harmless" aid that holds its recipients harmless, but certainly harms non-recipient districts that are more underaided than they would be otherwise if Adjustment Aid were fed into Equalization Aid.

There are several problems in the Education Law Center's, but one of the biggest is the conflation of low-DFG status with being "low wealth."

Table 4 presents the distribution of adjustment aid if the formula were fully funded and used a base year of 2014-15. [See Appendix A for district level data.] The total adjustment aid amount is $578 million. The aid is distributed across all types of districts: $216 million would be allocated to 14 former Abbott districts, and $362 million would be provided to 183 non-Abbotts; $237 million would be provided to 33 low wealth districts, $275 million to 120 middle wealth districts, and $45 million to 20 high wealth districts; $300 million would be allocated to 138 over adequacy districts, and $275 million to 50 below adequacy districts.

The huge mistake here is that a low-DFG district isn't necessarily low wealth.  The DFGs are badly out of date anyway, but they were socioeconomic classifications, not economic classifications.  Thus, a district can be in a low DFG but still have an average or high tax base and in fact, Adjustment Aid districts are more likely than not to be relatively wealthier in tax base than they are demographically.  
The Education Law Center considers any district in DFG A or B to be "low wealth," but of the 33 DFG A and B districts getting Adjustment Aid in the Education Law Center's report, only a handful actually have low tax bases.  

DFG A and B Districts Getting Adjustment Aid
DistrictCountyLocal Fair ShareTotal Number of StudentsLocal Fair Share per StudentAmount of Adjustment Aid in ELC's Alternative Calculations (assumes full SFRA funding, uses 2014-15 as base year)Actual Amount of Adjustment Aid in State Aid Summaries
SEA ISLE CITYCAPE MAY$34,151,45288$388,085$23,845$44,536
WILDWOOD CREST BOROCAPE MAY$18,478,211250$73,913$175,300$250,091
NORTH WILDWOOD CITYCAPE MAY$21,201,289328$64,638$285,751$396,411
WASHINGTON TWPBURLINGTON$1,856,01742$44,191$363,712$283,400
VENTNOR CITYATLANTIC$24,635,268817$30,153$629,687$700,622
LOWER CAPE MAY REGIONALCAPE MAY$25,743,1351,442$17,852$6,373,640$6,528,185
WILDWOOD CITYCAPE MAY$12,431,746738$16,845$1,977,300$3,567,304
MANCHESTER TWPOCEAN$48,500,9082,933$16,536$924,758$1,531,444
SEASIDE HEIGHTS BOROOCEAN$3,525,198226$15,598$188,824$410,159
MONTAGUE TWPSUSSEX$4,688,921301$15,578$480,230$26,780
WEYMOUTH TWPATLANTIC$2,633,754200$13,169$920,135$241,451
MIDDLE TWPCAPE MAY$30,809,2612,521$12,221$5,773,351$3,724,488
LOWER TWPCAPE MAY$21,889,7101,819$12,034$2,820,314$2,030,412
PINELANDS REGIONALOCEAN$18,417,7251,578$11,672$1,825,067$784,462
EAGLESWOOD TWPOCEAN$1,646,196145$11,353$410,558$58,181
CHESILHURSTCAMDEN$1,333,976118$11,305$910,892$691,027
JERSEY CITYHUDSON$335,745,96633,717$9,958$111,080,898$114,452,158
LITTLE EGG HARBOR TWPOCEAN$15,957,1451,777$8,980$2,909,076$1,427,520
WOODBINE BOROCAPE MAY$1,984,654232$8,555$968,892$761,240
ELK TWPGLOUCESTER$2,997,553351$8,540$438,143$38,757
ASBURY PARK CITYMONMOUTH$16,502,5492,337$7,061$23,420,836$24,422,872
VINELAND CITYCUMBERLAND$63,736,4309,885$6,448$10,817,844$34,392,237
LAKEHURST BOROOCEAN$2,434,311396$6,147$62,970$28,730
KEANSBURG BOROMONMOUTH$8,204,5271,547$5,304$9,303,939$8,642,285
PEMBERTON TWPBURLINGTON$23,198,5865,227$4,438$25,620,081$32,419,492
MILLVILLE CITYCUMBERLAND$26,258,7816,021$4,361$2,221,917$12,565,599
EAST ORANGEESSEX$44,660,84510,474$4,264$13,280,296$32,420,739
GLOUCESTER CITYCAMDEN$8,751,0002,074$4,219$3,745,077$9,360,582
BURLINGTON CITYBURLINGTON$9,741,8212,568$3,794$1,197,249$1,394,126
PLEASANTVILLE CITYATLANTIC$13,079,4113,978$3,288$4,607,944$14,090,235
PHILLIPSBURG TOWNWARREN$12,550,4173,911$3,209$2,542,230$9,997,105
SALEM CITYSALEM$2,904,2451,179$2,463$293,110$2,171,621
Total$236,593,866$319,854,251

The statewide average for Local Fair Share per student is about $10,000 per student.

As you can see, most of the DFG A and B recipients of Adjustment Aid are thus not truly "low wealth" at all.

In terms of tax base, they are medium wealth, high-wealth, and even ultra-high wealth.  Salem City, Phillipsburg, Pleasantville, Burlington City, Gloucester City, East Orange, Millville, Pemberton, Keansburg, Lakehurst, and Vineland are unequivocally "low wealth" but the other districts are medium wealth, high wealth, and ultra-high wealth.

So, of the $237 million that the ELC asserts would be "provided to 33 low wealth districts," only $73 million-$100 million goes to genuinely low-resource districts.  The other DFG A and B getting Adjustment Aid are not low-wealth in an economic sense.

Taken as a whole, Adjustment Aid is one of the most regressive streams of aid in the NJ aid distribution.  It goes to truly low-wealth districts less often than the ELC admits.  

It's notable that  Washington Township, North Wildwood, Wildwood Crest, and Sea Isle City in fact have more Local Fair Share per student than Millburn and Princeton.  In light of NJ's terrible budget picture, for these districts the question should be "should they receive any aid at all?" not "should they get Adjustment Aid?"

The ultra high wealth districts getting Adjustment Aid should, arguably, not be independent districts at all and should be merged with their neighbors.

It is worth pointing out that half of NJ's ultra-high wealth districts would get Adjustment Aid (which exceeds the state average of one-third of districts receiving Adjustment Aid).  This means that the richest districts in New Jersey are more likely to get Adjustment Aid than the poorest ones.  

Ultra High Resource Districts and Adjustment Aid
District NameCountyDFGLocal Fair ShareStudent Pop.Local Fair Share Per StudentAmount of Adjustment Aid in ELC's Alternative Calculations (assumes full SFRA funding, uses 2014-15 as base year)Actual Amount of Adjustment Aid Given in the State Aid Summaries (Does not count "Additional Adjustment Aid")
CAPE MAY POINTCAPE MAY$3,831,2143$1,277,071$20,442$20,226
ALLENHURSTMONMOUTH$4,770,9714$1,192,743$21,873$27,815
AVALON BOROCAPE MAYFG$59,473,86263$944,030$12,254$0
SEA ISLE CITYCAPE MAYB$34,151,45288$388,085$23,845$44,536
STONE HARBOR BOROCAPE MAYFG$30,768,64882$375,227$0$3,705
LONGPORTATLANTIC$15,252,42141$372,010$30,807$32,446
SADDLE RIVER BOROBERGENJ$48,204,780193$249,766$0$0
ALPINE BOROBERGENJ$33,818,844168$201,303$0$0
LONG BEACH ISLANDOCEANFG$44,619,512250$178,478$0$0
SEASIDE PARK BOROOCEANDE$5,951,88233$165,330$107,895$110,734
SPRING LAKE BOROMONMOUTHI$33,994,524271$125,441$0$0
SEA GIRT BOROMONMOUTHI$21,363,869178$120,022$0$0
LAVALLETTE BOROOCEANDE$16,792,324151$111,207$5,856$4,798
DEAL BOROMONMOUTH$17,212,918161$106,913$0$138,303
BEACH HAVEN BOROOCEANFG$8,104,90480$101,311$0$0
BAY HEAD BOROOCEANI$13,493,324135$99,951$0$0
CAPE MAY CITYCAPE MAYCD$15,801,869163$96,944$146,382$276,347
INTERLAKENMONMOUTH$3,396,05737$91,785$0$17,431
HARDING TOWNSHIPMORRISJ$31,097,756362$85,905$0$0
ROCKLEIGHBERGEN$2,594,63731$83,698$0$0
MARGATE CITYATLANTICDE$36,139,003459$78,734$0$45,463
WILDWOOD CREST BOROCAPE MAYB$18,478,211250$73,913$175,300$250,091
HOBOKEN CITYHUDSONFG$187,075,2362,639$70,889$3,808,8215,392,689
ENGLEWOOD CLIFFS BOROBERGENI$37,969,466553$68,661$0$0
NORTH WILDWOOD CITYCAPE MAYA$21,201,289328$64,638$285,751$396,411
BEDMINSTER TWPSOMERSETI$34,791,462546$63,721$0$0
AVON BOROMONMOUTHI$9,927,073159$62,434$0$0
OCEAN CITYCAPE MAYDE$96,496,9932,095$46,061$0$0
BRIGANTINE CITYATLANTICCD$32,792,678732$44,799$976,292$1,059,602
WASHINGTON TWPBURLINGTONA$1,856,01742$44,191$363,712283,400
MONMOUTH BEACH BOROMONMOUTHI$12,713,019295$43,095$0$1,986
EDGEWATER BOROBERGENGH$38,679,063938$41,236$0$0
FRANKLIN LAKES BOROBERGENI$51,923,7151,324$39,217$0$0
BOONTON TWPMORRISI$18,282,473477$38,328$0$0
BRADLEY BEACH BOROMONMOUTHCD$11,545,746306$37,731$550,106$674,206
SPRING LAKE HEIGHTS BOROMONMOUTHFG$13,088,499348$37,611$0$0
RUMSON BOROMONMOUTHJ$36,852,943989$37,263$0$0
MILLBURN TWPESSEXJ$181,130,0964,881$37,109$0$0
Total$6,529,336$8,780,189

The ELC intentionally omits this but, the majority of New Jersey's lowest-wealth districts would not get a cent of Adjustment Aid in the ELC's alternative calculations, including the very poorest districts of Bridgeton City, Camden City, North Hanover Township, Passaic, Trenton, Woodlynne, Paterson, Perth Amboy, Prospect Park, Elizabeth, and Newark.

Adjustment Aid is Privilege, Not Equity

Adjustment Aid is the biggest problem in the New Jersey education aid landscape.  It allows districts that have become wealthier and/or lost student population to cling to the aid they merited back when they were poor and/or larger.

Alas, the Education Law Center knows that hundreds of NJ districts are underaided and suffering, but its solution is hopelessly unrealistic. “It’s time to focus on the key task at hand – getting back on track to full funding of the SFRA to make sure all students receive the resources they need and a meaningful opportunity to succeed in school.”

I'm sorry, but full funding of SFRA ain't gonna happen. The only hope for NJ's most underaided and underfunded districts to free up money that is tied up in Adjustment Aid and going to districts that don't demographically or economically merit that money.

Again, contrary to the ELC's claims, very few truely low-wealth districts get Adjustment Aid. In the era of the Pension Crisis and stagnant state aid, Adjustment Aid cannot be justified.

---

See Also:

Adjustment Aid Has No Statutory Sunset