Monday, August 29, 2016

Education Spending Hasn't Reached Pre-Recession Levels


As millions of children across the country head back to school this month, they will be returning to schools with fewer teachers than in past years. Those teachers will be paid less, on average. And many of them will be working in school systems that receive less funding. 
The 7-year-old economic recovery has not been kind to the American public education system. In May 2008, as the Great Recession was just beginning, U.S. school departments employed 8.4 million teachers and other workers, according to the Bureau of Labor Statistics. This past May, they employed just 8.2 million — despite public-school enrollments that the Department of Education estimated have risen by more than 1 million students during the same period. Student-teacher ratios are as high as they’ve been since the late 1990s, though they’re still well below their levels of the 1980s and most of the 1990s. 
The staff cuts reflect a broader pullback in education funding in recent years. Public schools actually came through the recession relatively well, as stimulus money from the federal government helped offset cuts at the state and local levels. But federal dollars dried up before states were able to pick up the slack. In 2014, the latest year for which full data is available, state public-education funding was 6.6 percent lower than in 2008. (Local funding, which accounts for about 45 percent of school budgets, was down about 1 percent over the same span.) Federal spending rose, but not enough to overcome the state cuts: Per-student spending fell 2.4 percent after adjusting for inflation. (All spending figures in this story have been adjusted for inflation.) 
More spending, of course, doesn’t necessarily translate into better education, and budget watchdogs have long called on states to rein in spending on administrative salaries, building construction and other non-instructional items. But classrooms haven’t been spared; instructional spending has been cut at roughly the same rate as overall budgets.
According to the liberal-leaning Center on Budget and Policy Priorities, in inflation adjusted terms, NJ spends 7.5% less per student than it spent in 2008, which is bad, although near the national median.

State funding for education has declined by only 1.9% per student.

Thursday, August 25, 2016

The Abbotts Didn't and Don't Have NJ's Worst Municipal Overburden

One justification Robert Wilentz and the NJ Supreme Court gave for ordering massive state aid to the Abbott districts is that the Abbotts suffered from "municipal overburden" and thus were not in a position to increase their local taxes further.

As Wilentz wrote:

1. Municipal Overburden “Municipal overburden” is the excessive tax levy some municipalities must impose to meet governmental needs other than education. It is a common characteristic in poorer urban districts, a product of their relatively low property values against which the local tax is assessed and their high level of governmental need. The governmental need includes the entire range of goods and services made available to citizens: police and fire protection, road maintenance, social services, water, sewer, garbage disposal, and similar services. Although the condition is not precisely defined, it is usually thought of as a tax rate well above the average.

The underlying causes of municipal overburden are many and complex. Its consequences in this case, however, are clear and simple. The poorer urban school districts, sharing the same tax base with the municipality, suffer from severe municipal overburden; they are extremely reluctant to increase taxes for school purposes. Not only is their local tax levy well above average, so is their school tax rate. The oppressiveness of the tax burden on their citizens by itself would be sufficient to give them pause before raising taxes. Additionally, the rates in some cases are so high that further taxation may actually decrease tax revenues by diminishing total property values, either directly because of the tax-value relationship, or indirectly by causing business and industry to relocate to another municipality.

Indeed, there is much truth to what Wilentz said of the Abbotts and excessive taxes.

In FY1990, the average NJ property owner paid an all-in 2.041 tax rate, but the average Abbott property owner would have paid 2.918, a significantly higher figure.  A reasonable person could conclude that most (NOT ALL) of the Abbotts required significantly more state aid than they were then receiving.

Looking at the high (superficial) average, the high Abbott tax rate would seem to justify Wilentz' dictates, but the overall 2.918 Abbott average masks great diversity and completely omits any consideration of the many high-tax non-Abbotts who were left behind.

The problem with the New Jersey Supreme Court's decision in Abbott isn't the idea that poor districts needed more state aid to avoid municipal overburden, it's what districts the NJ Supreme Court designated as having those special needs.

Instead of using a data-based method to determine what districts had the highest taxes and should be the ones to get that extra aid, the NJ Supreme Court unilaterally decided that districts who were both in DFG A or B and classified as "urban" by the Department of Community Affairs had a claim to the money that poor or poorer non-urban districts didn't have.

 A number of the Abbott districts indeed suffered from municipal overburden, but not all of them did and there were a great many non-Abbotts that also had acute municipal overburden who were completely left out of the Abbott decision.

(I got the historical tax data from the Dept of Treasury. I've put it up on my Historical State Aid Data Spreadsheet.)


In terms of taxes, the creation of the Abbott list had more mistakes of exclusion than inclusion.

Most of the Abbotts did indeed have high taxes; but most of NJ's highest tax districts were not Abbotts.

Hence, if you actually look at the 50 towns in NJ with the highest tax rates, only 15 were Abbottized in 1990.  (Salem City was not Abbottized until 2004)

Click to Enlarge
If you look at the Abbotts themselves, their tax rates were much higher than average and were destructively high in Camden, East Orange, Orange, Bridgeton, and Asbury Park, but Abbott tax rates varied and so did the reasons for the excessive taxation.  Asbury Park's high taxes translated into very high student spending (in excess of Millburn) even in 1989-90, so its high tax burden can be seen as partly voluntary.

However, punishing taxes also existed in other low-DFG districts.  20 of the non-Abbott districts who were also among the 50 highest taxed towns were in DFG A or B:  Salem City (then DFG A), Penn's Grove (DFG A), Pine Hill (DFG B), Woodlynne (DFG B), Commercial Township (DFG A), Lawnside (DFG B), Clemonton (DFG B), Lawrence Township (DFG A), Chesilhurst (DFG A), Egg Harbor City (DFG A), Clayton (DFG B), Bellmawr (DFG B), Brooklawn (DFG B), Maurice River (DFG A), Fairfield Township (DFG A), Paulsboro (DFG A), Lakehurst (DFG A) Elk (DFG B), National Park (DFG A), and Greenwich (DFG B).  (these are 1980s DFG classifications)

Of the future Abbotts, you would not be able to say that Garfield, Burlington, Harrison, Perth Amboy, Neptune Township, Phillipsburg, and Hoboken had any kind of real municipal overburden.  (And Hoboken also already outspent Millburn in 1989-90.)

Click to Enlarge
The Supreme Court gave the legislature some discretion over the final composition of the Abbott list, but since the NJ Supreme Court came out with the Abbott II decision in early June and the budget had to finalized by the end of June, the legislature did not have the time to thoughtfully and thoroughly evaluate what districts most merited this mountain of state aid.  The only changes the legislature made were the additions of Neptune Township and Plainfield to the list of Abbott districts.

Today the immensity of state aid for the Abbotts has reduced their school taxes significantly and taken many Abbotts out of the realm of acute municipal overburden.

In 1990, fifteen of the 50 worst-taxed towns in NJ were Abbotts.  In 2016 only eight are.

Click to Enlarge:
Source: http://www.state.nj.us/dca/divisions/dlgs/resources/property_tax.html#1

In terms of school taxes alone, even fewer Abbotts were among the 50 highest taxed districts.


The Abbott decision was wrongheaded for multiple theoretical reasons. Abbott was wrongheaded for its insistence that money was the dominant factor in academic success, for its belief that the state could rigidly demarcate "urban poor" from all other districts, from its blindness towards the many struggling non-Abbotts who would be left behind.   Lastly, Abbott was wrongheaded because of the Supreme Court's repeated contempt for democracy and the elected branches.

However, the more I did into Abbott history the more I realize it was wrong even on factual reasons. The Abbotts weren't New Jersey's lowest spending, Pemberton was no instance of "society is failing," and the Abbotts, as a class, didn't have New Jersey's worst municipal overburden.

Finally, the relevance of the Abbotts not having NJ's worst municipal overburden cannot be emphasized enough in response to the Education Law Center's threats to launch another Abbott case.

The relevance of the Abbotts cannot be emphasized enough in condemning Chris Christie's failure to update the Abbott list.

I've said this before and said it again, but Abbott is judicial activism at its worst.

More Abbott History:

Saturday, August 13, 2016

The Great Abbott Tax Freeze

This post is about how the Abbott decisions of the 1990s and the ensuing flood of state money into the Abbotts allowed the Abbotts to freeze their school taxes.  This post provides shades of history as to why the Abbott districts, unlike poor non-Abbotts, pay nowhere near their full Local Fair Shares.

This is a story about Abbott unfairness that isn't often told. Many people outside of the Abbott districts know that Abbott has caused their own taxes to soar, but few realize just what a huge break the Abbott districts themselves got.


As usual, I got this data from the Department of Education via an OPRA request. I've put it all online on the Historical State Aid, Tax Levy, Tax Rate, and Spending Spreadsheets.

Info on NJ's Tax Levy Surge

From 1989-90 to 2015-16, New Jersey's total school tax levy increased from $4,558,222,671 to $13,957,747,742, or a 206% increase.

The median district's tax increase has been 224%, with Swedesboro-Woolwich having the biggest, with 1685% increase (from $800,000 to $15 million). Swedesboro's Equalized Valuation increased only from $92 million to $758 million (a factor of 8), so its tax rate has literally doubled, from 0.91 to 1.98.
The biggest decrease has been Camden's, where school taxes have fallen by 62% (from $19.6 million to $7.5 million). Camden's Equalized Valuation has actually increased, from $898 to $1.7 billion, so Camden's school tax levy has fallen from 2.19 to 0.47.

During these 26 years, inflation has been only 84% and the student population has increased by only a third. New Jersey's total Equalized Valuation (using adjustments for non-K-12 districts), increased from $509 billion to $1,165 billion, or a 128% increase.


What is shocking is that how exempt the Abbotts have been from increasing their taxes.

When the Abbott II decision came out most of the Abbott districts had substantially higher tax levies than they have now (adjusted for inflation).

District 1989-90 Tax Levy 2015-16 Tax Levy Percentage Increase
BURLINGTON CITY $3,937,817 $10,899,878 176.80%
PEMBERTON $5,321,419 $12,942,946 143.22%
NEPTUNE $15,477,594 $36,035,649 132.82%
HOBOKEN $17,878,915 $41,004,666 129.35%
LONG BRANCH $17,428,181 $37,901,052 117.47%
PHILLIPSBURG $5,295,655 $10,728,711 102.59%
GARFIELD $13,227,178 $25,989,445 96.49%
HARRISON $4,712,377 $9,229,913 95.87%
INFLATION 84%
ORANGE $6,862,215 $11,692,295 70.39%
MILLVILLE $6,655,325 $11,319,609 70.08%
ELIZABETH $36,849,087 $59,813,124 62.32%
NEW BRUNSWICK $17,604,644 $27,862,800 58.27%
GLOUCESTER CITY $2,690,467 $4,210,000 56.48%
NEWARK $74,008,652 $115,650,165 56.27%
VINELAND $14,282,074 $22,166,068 55.20%
PLEASANTVILLE $5,500,615 $8,311,512 51.10%
PLAINFIELD $15,914,470 $23,143,293 45.42%
TOTAL ABBOTT $536,608,170 $768,994,010 43.31%
PERTH AMBOY $15,701,730 $21,762,553 38.60%
KEANSBURG $3,617,566 $4,868,294 34.57%
WEST NEW YORK $11,247,010 $14,860,598 32.13%
EAST ORANGE $14,543,536 $18,950,050 30.30%
JERSEY CITY $90,913,927 $112,161,139 23.37%
PATERSON $32,932,844 $38,955,956 18.29%
PASSAIC $14,544,224 $16,818,577 15.64%
SALEM CITY $2,070,000 $2,392,321 15.57%
UNION CITY $14,119,701 $15,418,637 9.20%
BRIDGETON $3,491,084 $3,637,144 4.18%
TRENTON $21,410,019 $21,115,662 -1.37%
ASBURY PARK $6,870,119 $6,635,736 -3.41%
IRVINGTON $23,934,989 $17,459,529 -27.05%
CAMDEN $19,634,736 $7,449,009 -62.06%


In 1989-90, the total Abbott tax levy was 9.4% of NJ's total.  In 2015-16 it was only 5.6%.

Contrary to what has been implied by the Education Law Center and NJ Supreme Court, the Abbotts did not have NJ's highest Equalized school tax rates.  Of the districts with NJ's 50 highest Equalized Tax Rates in 1989-90, only three of them were Abbotts.  (Salem City had very high taxes, but it was Abbottized much later)

Winfield is obviously an outlier here.  I am skeptical that Winfield's tax rate really could be 6%, but Winfield's all-in taxes are the highest in NJ today, so the 6% tax rate may be a real number. Indeed, there are a few districts in NJ whose
taxes are that high now.
Since 1989-90, the median Abbott has only increased taxes by 53%.  The Abbotts' Equalized Tax Rate has fallen from 1.11 to only 0.69, whereas the state's (weighted) Equalized Tax Rate has risen from 0.86 to 1.25.


Most of the Abbotts have not done well in the last few decades, so it could be expected that their tax levy will lag the growth of the statewide tax levy, but poor non-Abbotts, by contrast, have been forced to accept significantly higher tax increases.

The 12 DFG A non-Abbotts (Atlantic City, Buena Regional, Seaside Heights, Woodbine, Paulsboro, Wildwood City, Lawrence Township, Downe, North Wildwood, East Newark, Commercial Township, and Fairfield Township) have increased their taxes by a median of 134%.

The 66 DFG B non-Abbotts have increased their taxes by a median of 204%

Not a single DFG A or B non-Abbott has been able to cut taxes in nominal dollars, although there are a few where the tax increases have lagged inflation.

Abbott Tax History

Immediately after the Abbott II decision most of the Abbotts actually had to increase their taxes.  For instance, Newark increased school taxes from $74 million to $82.7 million; Paterson increased school taxes from $33 million to $38 million; Trenton increased school taxes from $21 million to $25 million.

On the other hand, over two years Jersey City slashed its school taxes from $90 million to $68 million.

By 1993, however, Abbott tax increases were gone and the Abbotts were being flooded with more state aid than they knew what to do with.  After this point, the Abbotts were allowed to keep their tax levies constant while the rest of the state - included the poorest non-Abbotts - had no choice but to increase taxes.

In 1993-1994, the Abbotts (not counting Salem City), had a tax levy of $550,030,670. Five years later, in 1998-99, their total tax levy would only be $551,208,043. Over the next five years NJ had a serious budget crunch, but the Abbotts still received a deluge of money and only had a tax levy of $570,705,470 by 2003-04.  

Even the best-off Abbotts, Jersey City and Hoboken, did not have to raise their taxes. From 1994-95 to 2000-01, Hoboken's tax levy stayed in a very narrow band in the low $22 million range. Jersey City's tax levy stayed at exactly $72,094,096 for nine years. Jersey City's tax levy would not exceed the $90 million tax levy it had in 1989-90 until 2009-10.


While school districts in NJ have accepted a massive increase in their tax levies that surges well beyond inflation and student population growth, of the 31 Abbott districts, only eight have increased taxes faster than inflation.  The other Abbott districts have had effective tax decreases over the last 26 years.

The increase in the total tax levy is only exceeded by the increase in K-12 state aid, which increased from $2,491,585,444 to $8,020,259,660, or 246% during this period (63% of the surge in state aid went to the Abbotts; most NJ districts actually get less aid per student now than they did in 1989-90 adjusted for inflation)


As a consequence of the megamoney that the Abbott districts got in the 1990s and 2000s they fell significantly behind their Local Fair Shares and became accustomed to paying very little for their schools.

Even today, eight years after SFRA passed, only half of the Abbotts even pay 50% of their Local Fair Shares.

This gives taxes as a percentage of Local Fair Share.

In conclusion, in discussing the history of Abbott funding, it's critical to remember that not all of that money made it into Abbott classrooms or even Abbott bloat.  A lot of that money just offset taxes in Abbott districts or even just enabled Abbott districts to jack up their municipal taxes.

The history of Abbott districts going years, even decades, without increasing taxes indicates that the Abbott districts themselves don't believe Abbott Theory.

---

More Abbott History:


Monday, August 8, 2016

Phil Murphy Doesn't Understand State Aid

Phil Murphy just did an interview with Larry Mendte of "Jersey Matters" on several issues facing the state, including school aid.

The interviewer asked Murphy some pointed questions. In the first part, he asked Murphy would get
the money for everything that he has promised and why Phil Murphy never mentions that he worked for Goldman Sachs.  Murphy refused to directly answer to the first question about how he would pay for things, and instead said that a budget is a statement of a society's values, so the dollars and sense of costs can be figured out later.

Murphy said he didn't talk about being from Goldman Sachs because it "cuts both ways" and would turn off some voters, ie, the kind who supported Bernie Sanders.  Yet, he claims that being from Goldman Sachs gives him a great deal of insight into what facilitates economic growth.

Anyway, the section which most interests me occurs in the second part and is where Larry Mendte asks Phil Murphy what his plan on state aid is. If you're pressed for time and can't watch the whole interview, check out the 3:30 minute.

Larry Mendte frames the question of school aid with a short preamble about disproportionalities in funding, with some districts being overfunded and some districts being underfunded "for no rhyme or reason."

Rather than answer the question about redistributing money or comment on how unjust the status quo is, Murphy glibly vowed to "implement the formula," without any discussion of how much it would cost ($2 billion without redistribution) or where he would get the money from.  He then gave a semi-inaccurate explanation of SFRA.

Murphy repeats the description of SFRAthat "money follows the child," but claims that SFRA funds kids more who are from single-parent homes and who have learning disabilities, when this isn't true. SFRA have no references at all to giving more money to districts who have more kids from single-parent homes and intentionally assumes that every district in NJ has the same percentage of kids who have learning disabilities.  All else being equal, under SFRA, a district with a 25% classification rate would get the same amount of special education funding as a district with a 10% classification rate.

The major omission of Phil Murphy's answer is that he doesn't acknowledge that fully funding the K-12 component of SFRA would cost $2 billion (without redistribution), or give any pathway at all to where he is going to get that money.

Larry Mendte then asked Murphy, point blank, if he would move money from overfunded districts to underfunded districts. Murphy then repeats,  "I'd like to follow the formula."

Murphy never uses the word "SFRA," nor does he mention Abbott, which was what SFRA was a reform of. Murphy talks about his involvement with the NAACP, without mentioning that the NAACP supported the Abbott status quo and OPPOSED SFRA back in 2007-2008, when it was being passed.

Debt as a percentage of state income, 2013:
Source:
http://bit.ly/1leismy

If NJ had a flourishing economy or low debt, we could "implement that formula" but NJ's economy is one of the most stagnant in the US and our debt levels one of the highest.  The stagnant economy plus the indebtedness means that NJ isn't going to be able to come up with the additional money to fund SFRA and bring every underaided district up to fairness without tax increases of hitherto unconsidered size.

Murphy already has the most expensive gubernatorial agenda of anyone running this year.  Murphy's endorsement of providing "free" Pre-K to another 45,000 children would cost $607.5 million.  (45k x $13,500).


So I really worry about where Murphy is going to find the $2 billion for K-12 aid that we would need if we didn't redistribute.

Source, NJ Spotlight
Murphy has aid in the past that NJ can solve its budget crisis by reining in tax incentives, but when every single state in the US has its own aggressive tax incentive program, I don't see Murphy's unilateral disarmament as a smart idea.  Murphy also confuses tax incentives approved with money actually given out and ignores that tax incentives provide positive externalities for Smart Growth and urban revival objectives.  He has proposed his own slew of tax incentives too for things like college loan forgiveness.

Murphy comes off as uninformed (again) in this interview of how SFRA's formulas work or what the rationale for SFRA was, Murphy has been asked about state aid before and he must know about Steve Sweeney's state aid reform proposal, so I can surprised that by now he hasn't gotten up to speed on state aid.

My belief in that opposing redistribution, Murphy is actually being politically calculating, since he must know what what overaiding and redistribution are.  He does not want to take aid away from any district because it would (the horror!) alienate some voters and Murphy wants to pander his way into the governorship.

Murphy knows that the NJEA is not on board for redistribution and NJEA support is essential for him to win the Democratic primary. 

Phil Murphy knows that Steve Fulop and the Hudson County machine don't like Steve Sweeney. Murphy knows that he is the second choice of the Hudson County machine, after Steve Fulop himself.  Murphy calculates that if Fulop drops out, he can get that support and defeat Sweeney.

Phil Murphy claims to be the "governor who has your back," but in opposing redistribution, Murphy is taking the side of Hoboken, Jersey City, Asbury Park, Pemberton et al against the rest of New Jersey.  The status quo aid distribution is already an "us versus them" scenario where districts who are richer or smaller now than in the past continue to receive state aid at a level that is unjustified in light of their current resources and needs.

Districts who have gone the opposite way, and gotten poorer and/or larger, are screwed.  These are the districts who need a "governor who has their back."

From the looks of things, that governor isn't Phil Murphy.


Wednesday, August 3, 2016

The Savage Inequalities Abbott Ignored

One myth about the Abbott cases in New Jersey is that prior to the NJ Supreme Court's heroic takeover of school finance in 1990, the state singularly failed to live up to its constitutional obligation to provide a "thorough and efficient education" to children in poor urban districts.  According to David Sciarra of the Education Law Center, NJ had "two separate school systems, one for poor, one for rich."

Like most myths there's some truth to the notion of pre-Abbott II urban deprivation.  New Jersey's urban poor districts (later known as theAbbotts) did indeed spend less than the rich suburban districts.  Yes, the spending disparities translated into stark programmatic disparities between the rich and poor.  Due to the "nested inequalities" where urban kids were "doubly disadvantaged" in being poorer than kids in rich suburbs, the urban schools couldn't give urban kids what they needed.

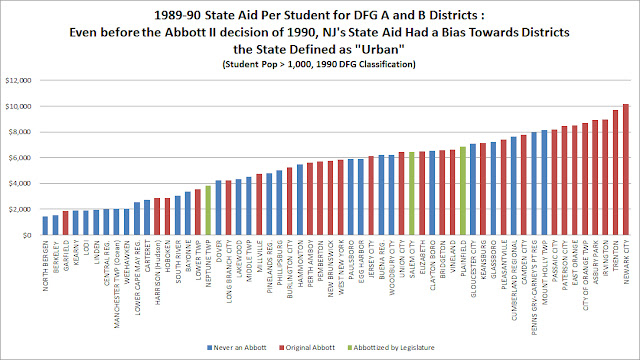
But what's never, ever discussed in the history of Abbott New Jersey school finance is that NJ had a smooth spectrum of spending, not "two separate school systems," and the Abbott districts in 1989-90 weren't New Jersey's budgetarily poorest. Not even close.  Prior to the Abbott II decision New Jersey's most underbudgeted districts were, with very few exceptions, rural districts, mostly in South Jersey, not urban districts at all.

The fact that New Jersey had a progressive aid distribution even in the 1980s has been forgotten.  The fact that Gov. Kean already had a special urban aid program in place that gave more money to urban poor districts than non-urban poor districts has been forgotten.  The fact that Newark alone got more state aid than Bergen County and the rest of Essex County combined hasn't been forgotten per se because it has never publicized at all.

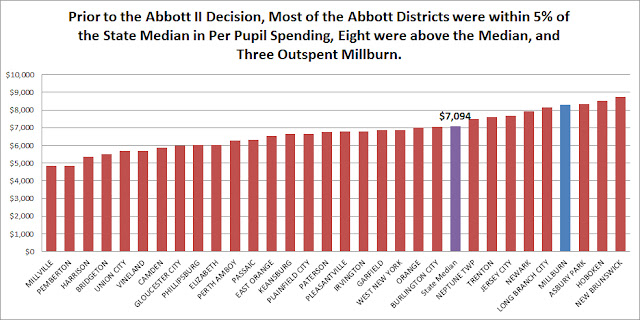
What people do not know anymore about the Abbott cases is that prior to the Abbott II decision of 1990, the future Abbott were disparate, but, as a class, only spent about 5% less than the state median.  

What I have never seen in journalism since the 1980s is that in 1989-90, eight of the Abbotts actually exceeded the state's average spending and three Abbotts - Hoboken, Asbury Park, and New Brunswick - actually outspent Millburn.

Of New Jersey's fifty lowest spending districts, only four (4) were Abbotts.  

(I got the data from the DOE via an OPRA request.  This Historical Budget Data spreadsheet contains the spending data, plus historical state aid and tax levy data.)

What I'm trying to do here is bust the Abbottist myth that New Jersey's governors and legislature singularly failed urban poor districts. If you reason that "average spending for demographically poor districts" = "constitutional violation," then the constitutional violation in New Jersey wasn't at its most severe in the Abbotts, since they were nearly average spending and had many districts below them.  If low spending alone creates a constitutional violation, then the biggest violation was for rural, South Jersey districts.

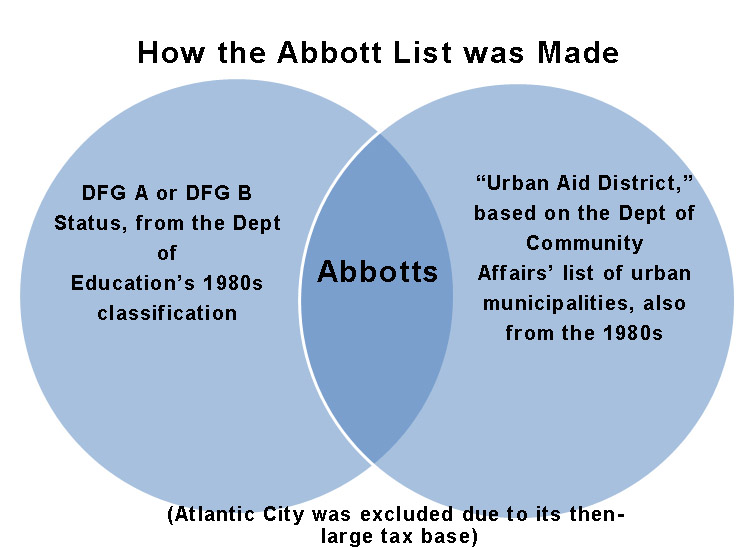
The only way the state failed the urban districts would be if you compared them to the richest suburban districts in New Jersey, which is precisely what the Education Law Center did in order to make the Abbott districts appear to be more deprived than they were.  


Abbott II was Based on Extremes in Spending 

What must be made clear about the Education Law Center's argument Abbott II case is that it focused on comparisons of seven of the poorest Abbotts - Camden, East Orange, Jersey City and Irvington, Newark, Paterson, and Trenton -  against ten of the most affluent and tax-supportive suburbs in New Jersey - Paramus, Princeton, Millburn, Scotch Plains-Fanwood, Livingston, South Brunswick, Cherry Hill, Moorestown, Montclair, and South Orange-Maplewood.

Kean's Justice and Education departments objected to the validity of this comparison, saying there was a continuum of financial resources, but Chief Justice Robert Wilentz rejected this counterargument:

The State further claims that the most intensive study conducted by plaintiffs, including the study of funding disparities, is limited to comparisons between plaintiffs' districts (Camden, East Orange, Jersey City and Irvington) and three others-Newark, Paterson, and Trenton, all contrasted with certain richer suburban districts (Paramus, Princeton, Millburn, Scotch Plains-Fanwood, Livingston, South Brunswick, Cherry Hill, Moorestown, Montclair, and South Orange-Maplewood). We agree that plaintiffs' most complete study of the characteristics of districts, including substantive education, was made in the form just mentioned. But when it came to funding disparities and their relationships, plaintiffs' comparisons were across the board.

Obviously, when comparison is between affluent and high-tax suburbs to the poorest cities there are going to be spending disparities and these disparities would be exacerbated for the urban students on account of their having greater needs.


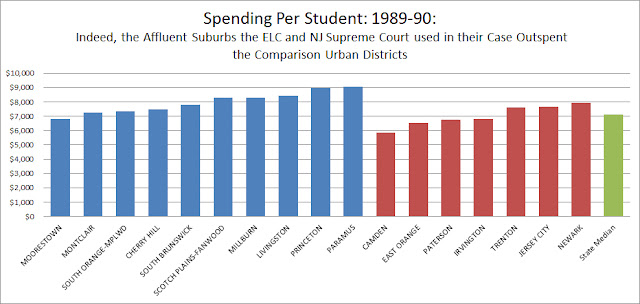
Indeed, what you have heard about unacceptable spending disparities between wealthy suburbs and the Abbotts is correct.  Wilentz documented many of the disparities in his Abbott II decision. That Raymond Abbott himself had a learning disability and received no services for his disability is heartbreaking.


But what is missing from the suburban-Abbott comparison is sensitivity to the rest of the state and an analysis of where the Abbotts were to the rest of the state.

In 1989-90, the median district in NJ spent $7,094 per student, with the weighted mean being somewhat higher, at $7,267 per student.  (vo-techs and some districts for which I did not have complete data are excluded.)

As you can see, the majority of the future Abbott districts were close to the median or exceeded it!  

Since the Abbott districts had more disadvantaged students than New Jersey's average district, one could still argue that the urban poor districts needed more than the average amount of money, but what this ignores is that the Abbotts weren't synonymous with New Jersey's lowest-budgeted districts.

Click to Enlarge
As you can see, this list is dominated by South Jersey rural districts.

There are only four "urban districts" among NJ's fifty lowest-spending districts and three of them (Bridgeton, Pemberton, and Millville) are rural anyway.  

Most of these lowest-spending districts include districts who are demographically poor too. Using the 1990 DFG classification (since it would be more contemporaneous than the 1980 classification). Fourteen districts in the bottom 50, Chesilhurst, Clementon, Fairfield, Elk, Westfield, Haledon, Prospect Park, Deerfield, Ocean Gate, North Bergen, Clayton, National Park, Lower Township, and Mullica were in DFG A or B. Another seven, New Hanover, Franklin, Winslow, Monroe, Freehold Boro, Pittsgrove, and Florence were in DFG CD.

*When I ran these calculations I could not believe that New Hanover and Chesilhurst only spent $1,000 per student, but I have double-checked the numbers I got from the Department of Education and cross-checked school spending with each district's local tax levy and state aid, and the $1,000 per student figures seem to be accurate.  Even if it turns out that there is some mistake and New Hanover and Chesilhurst spent more than $1000 per student, the basic point that the most underbudgeted districts in New Jersey were mostly non-urban still holds.

Abbott: Judicial Activism at its Worst

A reasonable person could believe that urban social problems were deeper than rural social problems and that therefore extra state aid for urban districts was justified.  A reasonable person could believe that Abbott districts suffered from "municipal overburden" and therefore more state aid was justified.  Clearly the cost of living is higher in North Jersey than South Jersey, so some spending disparities are justified. Furthermore, some of the poorest non-Abbotts are not K-12 districts, so their spending also should logically be lower.

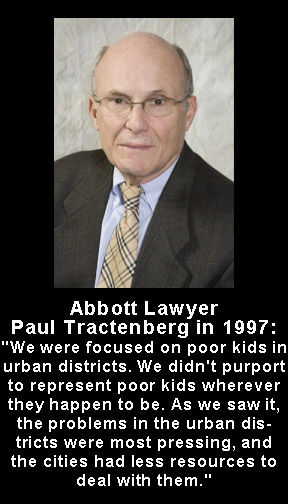
A reasonable person can say that urban problems were "more pressing," but the second part of Tractenberg's assertion, that the urban districts "had less resources to deal with them" is untrue of the Abbotts as a class.  A handful of Abbott districts were indeed badly underresourced and those were the districts the Education Law Center used to argue its case, but the deep problems of Camden, East Orange, Jersey City and Irvington, Newark, Paterson, and Trenton did not exist to the same degree in all of the Abbott districts and the problems that existed in the poorest Abbotts existed in greater or equal depth in districts that were not legally considered "urban."

Chief Justice Robert Wilentz said that "society was failing" in the Abbott districts, hence the massive aid he ordered, but other poor districts still needed to keep their buildings warm in winter, still needed to bus kids, still needed to pay teachers, still needed to insure themselves, and still needed to buy equipment.  Why should heating oil cost more in Newark than in East Newark?  Why should a basketball court more for Bridgeton than for Fairfield Township?  Why should health insurance for a teacher cost more for Pemberton than for Eastampton?  Why need teacher salaries be higher for Harrison than North Bergen?  Why should a computer cost more for New Brunswick than Sayreville?

These are the Savage Inequalities that Abbott forgot.

Against the State's argument that New Jersey had a continuum of need and that the Millburn/Newark comparison was unrepresentative of the state, Robert Wilentz and the Supreme Court stood athwart justice and said that only the problems of urban districts, even if they were not the most severe, mattered.  And against common sense, the Supreme Court asserted that you could draw rigid demarcation between "urban" and "suburban."

Jim Florio had originally only wanted to bring the urban districts up to the 60th percentile, but he and Christie Whitman complied with the NJ Supreme Court "Parity Spending" and later "Parity Plus" orders anyway.

Over the next several years Abbott state aid would double, from $1,024,840,106 in 1989-90 to $2,291,696,951 in 1997-1998, when the Abbotts reached parity with DFG I and J districts.  From 1997-1998 to today, Abbott aid would double again, to $5.1 billion.  

Even the Abbotts who were already the best aided saw large gains:
  • Hoboken's state aid rose from $6.9 million to $10.2 million from 1989-90 to 1993-94.
  • Asbury Park's state aid rose from $12.3 million to $21.6 million. 
  • New Brunswick's state aid rose from $12.2 million to $21.2 million.
DFG A and B districts, from 1989-90 to today, only had their aid double over this twenty-six year timeframe.

For anyone seeking an example of the dangers of judicial activism, look at Abbott.


---

More Abbott History Pieces: 


---

Note on the data:  I got the data from the Department of Education via an OPRA request.  I got the enrollment data via scans of original 1990 documents.  I had to enter the enrollment data into an Excel spreadsheet by hand.  If there was a typo in the documents I saw or I created a typo, please excuse me.

I can forward to anyone the enrollment data sheets.  Email me at stateaidguy@gmail.com if you want them.

I did not have enrollment data for every district I had budgetary data for.   I have omitted those districts from my calculations.

I did not factor in vo-techs into my state spending averages and median calculations.