 |
| Hey Education Law Center + NJ Supreme Court! |
An example of this occurs in Deborah Yaffe's 2007 history of the Abbott cases, Other People's Children, where she writes:
The picture is mixed. Look at elementary school scores, and it is difficult not to feel optimistic; look at middle and high school scores, and it is difficult not to feel discouraged. (324)
I don't know if this statement correct in 2007 or what research it was based on, but the claim that the Abbotts do well on the elementary level isn't correct today.
If you compare the elementary school scores of the over-Adequacy and near-Adequacy Abbott districts with the most severely under-Adequacy non-Abbotts the non-Abbotts do slightly better.
Lest this post be construed as a "money doesn't matter," argument. Again, let me clarify once again my premises on school spending and Abbott.
- Money matters in education.
- NJ's debt and economic stagnation are among the worst in the United States.
- State Aid is therefore zero-sum.
- Abbott "Parity Plus" spending and the superhigh Adequacy Budgets embedded in SFRA are beyond the point of Diminishing Returns
- Sustaining superhigh state aid for the Abbotts thereby deprives equally needy districts of the money they need.
The point of this post and related posts I've written to demonstrate #4, which is Abbott spending is beyond the point of effectiveness.
According to the Education Law Center itself, the eight highest spending Abbott districts (relative to their Adequacy Budgets) are Asbury Park, Hoboken, Gloucester City, Pemberton, Keansburg, Phillipsburg, who are all above Adequacy, and Burlington City and Pleasantville, who spend over $17,000 per student, but are slightly below Adequacy. Asbury Park is the most over Adequacy, exceeding its Adequacy Budget by $5,617 per student.
The 18 elementary schools of these Abbott districts have an average FRL-eligibility of 70%.
The 19 elementary schools of these non-Abbott districts have an average FRL-eligibility of 71%.
ETA: I don't have data on school level Free-lunch eligibility, but if you go by district data, the non-Abbotts have much higher Free-lunch eligibility and significantly higher LEP-percentages.
| ABBOTTS | ||||
| District | Total | FL | RL | LEP |
| Asbury Park | 1,993.50 | 1,790.50 | 69 | 185 |
| Keansburg | 1,543.00 | 972 | 160.5 | 36 |
| Phillipsburg | 3,681.00 | 1,652.00 | 299 | 106 |
| Burlington City | 1,735.00 | 952 | 111 | 74 |
| Pemberton | 5,035.00 | 1,791.00 | 562 | 56 |
| Gloucester City | 2,055.00 | 1,168.00 | 240 | 47 |
| Hoboken | 1,970.00 | 902 | 66 | 21 |
| Pleasantville | 3,769.00 | 2,937.00 | 279 | 542 |
| TOTAL | 21,781.50 | 12,164.50 | 1786.5 | 1067 |
| Weighted Percentages | 56% | 8% | 5% | |
| NON-ABBOTTS | ||||
| District | Total | FL | RL | LEP |
| East newark | 254 | 194 | 29 | 46 |
| Guttenberg | 1,022.00 | 727 | 72 | 56 |
| Fairview | 1,269.00 | 885 | 93 | 174 |
| Prospect Park | 878 | 682 | 61 | 20 |
| Bayonne | 9,555.00 | 5,325.50 | 870.5 | 329 |
| Freehold Boro | 1,563.00 | 1,101.00 | 98 | 222 |
| Red Bank Boro | 1,159.00 | 953 | 80 | 396 |
| Bound Brook | 1,713.50 | 1,048.00 | 210 | 210 |
| TOTAL | 17413.5 | 10915.5 | 1513.5 | 1453 |
| Weighted Percentages | 63% | 9% | 8% |
Although in terms of student economic disadvantage these districts are very similar, they are worlds apart budgetarily.
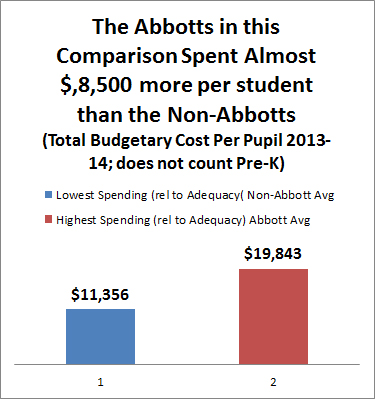
The eight Abbotts have an average Total Budgetary Cost Per Pupil of $19,843.
The eight non-Abbotts have an average Total Budgetary Cost Per Pupil of $11,356.
Not even counting Pre-K and construction money, the Abbotts spend $8,500 more per student.
So with clear-cut budgetary superiority there should be at least a palpable academic superiority, right?
NO.
The eighteen high-spending Abbott elementary schools with tested students on average are, at the 18th percentile in statewide performance.
The eighteen low-spending non-Abbott elementary schools with tested students are, on average, at the 35th percentile in statewide performance. (all averages in this post are unweighted)


When you hone in on 4th grade scores on the old NJASK (which I consider the last valid year for scores due to PARCC-era opt-outs), the disadvantaged non-Abbotts do better.

On English Language Arts, the 50th percentile for kids in the Abbott districts is 190 (the state average was 202.)

For non-Abbotts the 50th percentile for kids in the non-Abbotts is 198.
On math, the 50th percentile is for kids in the Abbott districts is 212.

Grade 4 Science scores are broken out by Advanced Proficient, Proficient, and Below Proficient status, not percentiles, but the result is the same: the severely underfunded non-Abbotts doing better, with 85% of the students in the severely under-budget non-Abbott schools getting Advanced Proficient or Proficient scores compared to only 81% of the students in the Abbotts.
At for Advanced Proficient scores the gap is even wider: the non-Abbott schools averaged 40% Advanced Proficient compared to 25% in the Abbotts.

Even if you look at absenteeism the non-Abbotts do better. The Abbotts have chronic absenteeism at 14%. The non-Abbotts have a chronic absenteeism rate of 8%.
One of the justifications for Abbott superspending and superlative facilities was that you had to have schools so beautiful and light-filled that kids wouldn't want to be absent. It seems to be yet another incorrect theory.

There are claims out there that Abbott spending is effective. The Education Law Center just came out with a press release, "THE GOVERNOR IS WRONG ON STUDENT ACHIEVEMENT," which

There are claims out there that Abbott spending is effective. The Education Law Center just came out with a press release, "THE GOVERNOR IS WRONG ON STUDENT ACHIEVEMENT," which
summarizes research that suggests that Abbott was working and cherry-picks Union City to argue that superspending is academically necessary and beneficial.
The ELC's press release begins:
Governor Chris Christie attempts to justify his proposal to take massive amounts of school aid away from NJ districts educating the most disadvantaged students by making claims about student achievement that simply aren’t true.But the governor is not "just plain wrong" about Abbott ineffectiveness, but he makes a foolish mistake in comparing Abbotts to their charter schools and not poor non-Abbotts.
The Governor says districts with high student need “get a big check from the state every year, [but] they are not making any changes in the way they educate children and they are not showing any increase in success."
The Governor is just plain wrong. The facts show NJ's most disadvantaged students making substantial gains over the last 15 years, and studies have documented the positive connection between increased funding and improved student outcomes.
The Abbotts have a clear cut, immense budgetary advantage. For Abbott Theory to be correct, a clear-cut advantage in spending should drive clear-cut higher academic performance than in districts that don't have Abbott money, but not only is there no clear-cut superiority, there's not even ambiguous superiority. In fact, the Abbotts appear to be doing worse.
And what if my sample isn't statistically valid enough to prove to Abbottists that Abbott superspending isn't effective? So what. If the Abbotts have 5% academic superiority for 50% spending advantage, that isn't a strong argument to sustain Abbott.
And what if my sample isn't statistically valid enough to prove to Abbottists that Abbott superspending isn't effective? So what. If the Abbotts have 5% academic superiority for 50% spending advantage, that isn't a strong argument to sustain Abbott.
And finally, what was affordable in the 1990s isn't affordable today. New Jersey's economy has been stagnant for years and we are one of the country's most indebted states.
State aid is zero-sum and more money for the Abbotts means less money for every other district including many districts who are just as poor as the Abbotts.
Abbott: Ineffective, Unaffordable, Unfair.
Jeff,
ReplyDeleteDid you control for school-level demographics, including LEP and special needs as well as free lunch or are you just comparing elementary schools and assuming comparable district wide demographics?
Did you include charter students? They also benefit from the additional funding and charters are concentrated in the former Abbots and tend to have the highest scoring students because of creaming.
You may want to look at Bruce's analysis in which he looks at score growth over multiple years at all K-8 schools, controlling for demographics plus funding.
Here's the link: https://schoolfinance101.wordpress.com/2015/01/30/ed-writers-try-looking-beyond-propaganda-press-releases-for-success-stories/
Julia,
DeleteThank you for reading and commenting.
I used the School Performance Reports for school-level Economically Disadvantaged (FRL) rates. I didn’t have access to school-level FL rates, but when I looked at the district-level data in the Enrollment files from 2013-14 I found that the non-Abbotts actually had HIGHER average FL rates.
The eight Abbotts districts here are 55% FL eligible. The eight non-Abbotts districts are 70% FL eligible.
I didn’t FL include this originally because I am doing school-specific comparisons and if I throw in a district-wide comparison it would require a paragraph of explanation that would distract from my overall point.
The school-level comparisons are heavily weighted towards big districts like Bayonne and I was trying to not get too deep into statistical weeds. Also, for some districts, like Phillipsburg, there’s an influx of kids from outside the town in high school and that skews the district-level numbers. (Phillipsburg HS has kids from a few other towns.)
Although the Abbotts as a whole might have higher FL rates than the eight non-Abbotts discussed here, districts like Pemberton, Phillipsburg, and Hoboken don’t have high FL rates at all. Pemberton was only 35% FL. Phillipsburg was only 45% FL. Hoboken was 46% FL.
I didn’t look at LEP. It was just a step I skipped, but I think the non-Abbotts would be higher or the same. Hoboken, Pemberton, Phillipsburg are 1% LEP, after all. You can criticize me for not looking at LEP, but LEP rates don’t vary as much as FRL/FL rates do and there’s more subjectivity involved in diagnosis.
I made no attempt to control for charters, but charterization was a reason I initially avoided elementary-level comparisons and focused on high school comparisons. Surely in some cases, like Hoboken, charters are a negative academic impact, but charters aren’t as big a factor in most of these districts. Red Bank Boro is a non-Abbott and it’s negatively affected by a charter school, so there is a slight evening-out between Abbotts and non-Abbotts of the charter skimming effect.
I looked at the Bruce Baker post you forwarded. It looks like a charter/non-charter comparison and that is not what I am interested in here. I am interested in Abbott/high-FRL non-Abbott comparisons.
Again, thank you for reading.
Jeff,
ReplyDeleteBruce's blog includes a list of K-8 schools across the state, evaluated based on multi-year growth, adjusted for funding and demographics.
You also would need to include charter in any analysis. They are a third or more of Newark and Camden and Hoboken publicly-funded students and account for substantial percentages of other former Abbotts as well.
I think that evaluating the efficacy of spending by looking at the Abbotts as a whole might be impossible now due to most of the Abbotts being under Adequacy anyway and several of them being chartered up. Hoboken and Asbury Park are also affected by Interdistrict Choice. Hoboken has ~160 Interdistrict Choice student (IIRC) who probably lift its scores; Asbury Park loses a few score too and their departure probably sinks Asbury's scores.
DeletePerhaps I ought to include notes about charter and Interdistrict Choice effects in Asbury Park, Hoboken, and Red Bank Boro, but I don't think this would change the conclusion which is that even the most budgetarily advantaged high-FRL districts don't outperform the most budgetarily disadvantaged districts.