Saturday, August 13, 2016

The Great Abbott Tax Freeze

This post is about how the Abbott decisions of the 1990s and the ensuing flood of state money into the Abbotts allowed the Abbotts to freeze their school taxes.  This post provides shades of history as to why the Abbott districts, unlike poor non-Abbotts, pay nowhere near their full Local Fair Shares.

This is a story about Abbott unfairness that isn't often told. Many people outside of the Abbott districts know that Abbott has caused their own taxes to soar, but few realize just what a huge break the Abbott districts themselves got.


As usual, I got this data from the Department of Education via an OPRA request. I've put it all online on the Historical State Aid, Tax Levy, Tax Rate, and Spending Spreadsheets.

Info on NJ's Tax Levy Surge

From 1989-90 to 2015-16, New Jersey's total school tax levy increased from $4,558,222,671 to $13,957,747,742, or a 206% increase.

The median district's tax increase has been 224%, with Swedesboro-Woolwich having the biggest, with 1685% increase (from $800,000 to $15 million). Swedesboro's Equalized Valuation increased only from $92 million to $758 million (a factor of 8), so its tax rate has literally doubled, from 0.91 to 1.98.
The biggest decrease has been Camden's, where school taxes have fallen by 62% (from $19.6 million to $7.5 million). Camden's Equalized Valuation has actually increased, from $898 to $1.7 billion, so Camden's school tax levy has fallen from 2.19 to 0.47.

During these 26 years, inflation has been only 84% and the student population has increased by only a third. New Jersey's total Equalized Valuation (using adjustments for non-K-12 districts), increased from $509 billion to $1,165 billion, or a 128% increase.


What is shocking is that how exempt the Abbotts have been from increasing their taxes.

When the Abbott II decision came out most of the Abbott districts had substantially higher tax levies than they have now (adjusted for inflation).

District 1989-90 Tax Levy 2015-16 Tax Levy Percentage Increase
BURLINGTON CITY $3,937,817 $10,899,878 176.80%
PEMBERTON $5,321,419 $12,942,946 143.22%
NEPTUNE $15,477,594 $36,035,649 132.82%
HOBOKEN $17,878,915 $41,004,666 129.35%
LONG BRANCH $17,428,181 $37,901,052 117.47%
PHILLIPSBURG $5,295,655 $10,728,711 102.59%
GARFIELD $13,227,178 $25,989,445 96.49%
HARRISON $4,712,377 $9,229,913 95.87%
INFLATION 84%
ORANGE $6,862,215 $11,692,295 70.39%
MILLVILLE $6,655,325 $11,319,609 70.08%
ELIZABETH $36,849,087 $59,813,124 62.32%
NEW BRUNSWICK $17,604,644 $27,862,800 58.27%
GLOUCESTER CITY $2,690,467 $4,210,000 56.48%
NEWARK $74,008,652 $115,650,165 56.27%
VINELAND $14,282,074 $22,166,068 55.20%
PLEASANTVILLE $5,500,615 $8,311,512 51.10%
PLAINFIELD $15,914,470 $23,143,293 45.42%
TOTAL ABBOTT $536,608,170 $768,994,010 43.31%
PERTH AMBOY $15,701,730 $21,762,553 38.60%
KEANSBURG $3,617,566 $4,868,294 34.57%
WEST NEW YORK $11,247,010 $14,860,598 32.13%
EAST ORANGE $14,543,536 $18,950,050 30.30%
JERSEY CITY $90,913,927 $112,161,139 23.37%
PATERSON $32,932,844 $38,955,956 18.29%
PASSAIC $14,544,224 $16,818,577 15.64%
SALEM CITY $2,070,000 $2,392,321 15.57%
UNION CITY $14,119,701 $15,418,637 9.20%
BRIDGETON $3,491,084 $3,637,144 4.18%
TRENTON $21,410,019 $21,115,662 -1.37%
ASBURY PARK $6,870,119 $6,635,736 -3.41%
IRVINGTON $23,934,989 $17,459,529 -27.05%
CAMDEN $19,634,736 $7,449,009 -62.06%


In 1989-90, the total Abbott tax levy was 9.4% of NJ's total.  In 2015-16 it was only 5.6%.

Contrary to what has been implied by the Education Law Center and NJ Supreme Court, the Abbotts did not have NJ's highest Equalized school tax rates.  Of the districts with NJ's 50 highest Equalized Tax Rates in 1989-90, only three of them were Abbotts.  (Salem City had very high taxes, but it was Abbottized much later)

Winfield is obviously an outlier here.  I am skeptical that Winfield's tax rate really could be 6%, but Winfield's all-in taxes are the highest in NJ today, so the 6% tax rate may be a real number. Indeed, there are a few districts in NJ whose
taxes are that high now.
Since 1989-90, the median Abbott has only increased taxes by 53%.  The Abbotts' Equalized Tax Rate has fallen from 1.11 to only 0.69, whereas the state's (weighted) Equalized Tax Rate has risen from 0.86 to 1.25.


Most of the Abbotts have not done well in the last few decades, so it could be expected that their tax levy will lag the growth of the statewide tax levy, but poor non-Abbotts, by contrast, have been forced to accept significantly higher tax increases.

The 12 DFG A non-Abbotts (Atlantic City, Buena Regional, Seaside Heights, Woodbine, Paulsboro, Wildwood City, Lawrence Township, Downe, North Wildwood, East Newark, Commercial Township, and Fairfield Township) have increased their taxes by a median of 134%.

The 66 DFG B non-Abbotts have increased their taxes by a median of 204%

Not a single DFG A or B non-Abbott has been able to cut taxes in nominal dollars, although there are a few where the tax increases have lagged inflation.

Abbott Tax History

Immediately after the Abbott II decision most of the Abbotts actually had to increase their taxes.  For instance, Newark increased school taxes from $74 million to $82.7 million; Paterson increased school taxes from $33 million to $38 million; Trenton increased school taxes from $21 million to $25 million.

On the other hand, over two years Jersey City slashed its school taxes from $90 million to $68 million.

By 1993, however, Abbott tax increases were gone and the Abbotts were being flooded with more state aid than they knew what to do with.  After this point, the Abbotts were allowed to keep their tax levies constant while the rest of the state - included the poorest non-Abbotts - had no choice but to increase taxes.

In 1993-1994, the Abbotts (not counting Salem City), had a tax levy of $550,030,670. Five years later, in 1998-99, their total tax levy would only be $551,208,043. Over the next five years NJ had a serious budget crunch, but the Abbotts still received a deluge of money and only had a tax levy of $570,705,470 by 2003-04.  

Even the best-off Abbotts, Jersey City and Hoboken, did not have to raise their taxes. From 1994-95 to 2000-01, Hoboken's tax levy stayed in a very narrow band in the low $22 million range. Jersey City's tax levy stayed at exactly $72,094,096 for nine years. Jersey City's tax levy would not exceed the $90 million tax levy it had in 1989-90 until 2009-10.


While school districts in NJ have accepted a massive increase in their tax levies that surges well beyond inflation and student population growth, of the 31 Abbott districts, only eight have increased taxes faster than inflation.  The other Abbott districts have had effective tax decreases over the last 26 years.

The increase in the total tax levy is only exceeded by the increase in K-12 state aid, which increased from $2,491,585,444 to $8,020,259,660, or 246% during this period (63% of the surge in state aid went to the Abbotts; most NJ districts actually get less aid per student now than they did in 1989-90 adjusted for inflation)


As a consequence of the megamoney that the Abbott districts got in the 1990s and 2000s they fell significantly behind their Local Fair Shares and became accustomed to paying very little for their schools.

Even today, eight years after SFRA passed, only half of the Abbotts even pay 50% of their Local Fair Shares.

This gives taxes as a percentage of Local Fair Share.

In conclusion, in discussing the history of Abbott funding, it's critical to remember that not all of that money made it into Abbott classrooms or even Abbott bloat.  A lot of that money just offset taxes in Abbott districts or even just enabled Abbott districts to jack up their municipal taxes.

The history of Abbott districts going years, even decades, without increasing taxes indicates that the Abbott districts themselves don't believe Abbott Theory.

---

More Abbott History:


Tuesday, July 26, 2016

Abbott Ineffectiveness, Elementary School Edition

Hey Education Law Center +
NJ Supreme Court!
A meme about Abbott academic performance I've occasionally seen concedes that by high school that all the effects of Abbott spending have faded out, but in elementary school the Abbotts do well.

An example of this occurs in Deborah Yaffe's 2007 history of the Abbott cases, Other People's Children, where she writes:

The picture is mixed. Look at elementary school scores, and it is difficult not to feel optimistic; look at middle and high school scores, and it is difficult not to feel discouraged.  (324)

I don't know if this statement correct in 2007 or what research it was based on, but the claim that the Abbotts do well on the elementary level isn't correct today.

If you compare the elementary school scores of the over-Adequacy and near-Adequacy Abbott districts with the most severely under-Adequacy non-Abbotts the non-Abbotts do slightly better.

Lest this post be construed as a "money doesn't matter," argument.  Again, let me clarify once again my premises on school spending and Abbott.


  1. Money matters in education.
  2. NJ's debt and economic stagnation are among the worst in the United States.
  3. State Aid is therefore zero-sum.
  4. Abbott "Parity Plus" spending and the superhigh Adequacy Budgets embedded in SFRA are beyond the point of Diminishing Returns
  5. Sustaining superhigh state aid for the Abbotts thereby deprives equally needy districts of the money they need.  

The point of this post and related posts I've written to demonstrate #4, which is Abbott spending is beyond the point of effectiveness.

According to the Education Law Center itself, the eight highest spending Abbott districts (relative to their Adequacy Budgets) are Asbury Park, Hoboken, Gloucester City, Pemberton, Keansburg, Phillipsburg, who are all above Adequacy, and Burlington City and Pleasantville, who spend over $17,000 per student, but are slightly below Adequacy.  Asbury Park is the most over Adequacy, exceeding its Adequacy Budget by $5,617 per student.

The 18 elementary schools of these Abbott districts have an average FRL-eligibility of 70%.

The eight lowest spending non-Abbott districts (relative to their Adequacy Budgets) are Bayonne, East Newark, Guttenberg, Fairview, Red Bank Boro, Freehold Boro, Bound Brook, and Prospect Park.  East Newark is the most under Adequacy, with a 2014-15 Adequacy Budget gap of -$10,097 per student.  Red Bank Boro has the smallest Adequacy gap in this cluster, but it is still -$6,759 per student.

The 19 elementary schools of these non-Abbott districts have an average FRL-eligibility of 71%.

ETA: I don't have data on school level Free-lunch eligibility, but if you go by district data, the non-Abbotts have much higher Free-lunch eligibility and significantly higher LEP-percentages.

ABBOTTS
DistrictTotalFLRLLEP
Asbury Park1,993.501,790.5069185
Keansburg1,543.00972160.536
Phillipsburg3,681.001,652.00299106
Burlington City1,735.0095211174
Pemberton5,035.001,791.0056256
Gloucester City2,055.001,168.0024047
Hoboken1,970.009026621
Pleasantville3,769.002,937.00279542
TOTAL21,781.5012,164.501786.51067
Weighted Percentages56%8%5%
NON-ABBOTTS
DistrictTotalFLRLLEP
East newark2541942946
Guttenberg1,022.007277256
Fairview1,269.0088593174
Prospect Park8786826120
Bayonne9,555.005,325.50870.5329
Freehold Boro1,563.001,101.0098222
Red Bank Boro1,159.0095380396
Bound Brook1,713.501,048.00210210
TOTAL17413.510915.51513.51453
Weighted Percentages63%9%8%

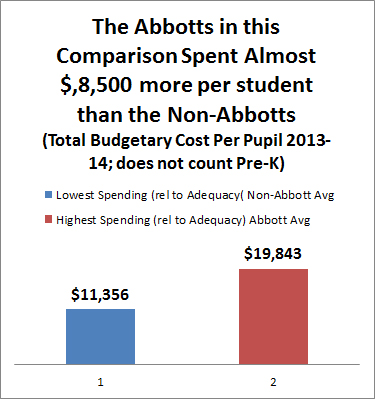
Although in terms of student economic disadvantage these districts are very similar, they are worlds apart budgetarily.

The eight Abbotts have an average Total Budgetary Cost Per Pupil of $19,843.

The eight non-Abbotts have an average Total Budgetary Cost Per Pupil of $11,356.

Not even counting Pre-K and construction money, the Abbotts spend $8,500 more per student.

So with clear-cut budgetary superiority there should be at least a palpable academic superiority, right?

NO.

The eighteen high-spending Abbott elementary schools with tested students on average are, at the 18th percentile in statewide performance.

The eighteen low-spending non-Abbott elementary schools with tested students are, on average, at the 35th percentile in statewide performance.   (all averages in this post are unweighted)


When you hone in on 4th grade scores on the old NJASK (which I consider the last valid year for scores due to PARCC-era opt-outs), the disadvantaged non-Abbotts do better.

On English Language Arts,  the 50th percentile for kids in the Abbott districts is 190 (the state average was 202.)  


For non-Abbotts the 50th percentile for kids in the non-Abbotts is 198.  

On math, the 50th percentile is for kids in the Abbott districts is 212.


Grade 4 Science scores are broken out by Advanced Proficient, Proficient, and Below Proficient status, not percentiles, but the result is the same: the severely underfunded non-Abbotts doing better, with 85% of the students in the severely under-budget non-Abbott schools getting Advanced Proficient or Proficient scores compared to only 81% of the students in the Abbotts.

At for Advanced Proficient scores the gap is even wider: the non-Abbott schools averaged 40% Advanced Proficient compared to 25% in the Abbotts.


Even if you look at absenteeism the non-Abbotts do better.   The Abbotts have chronic absenteeism at 14%.  The non-Abbotts have a chronic absenteeism rate of 8%.   

One of the justifications for Abbott superspending and superlative facilities was that you had to have schools so beautiful and light-filled that kids wouldn't want to be absent.  It seems to be yet another incorrect theory.


There are claims out there that Abbott spending is effective. The Education Law Center just came out with a press release, "THE GOVERNOR IS WRONG ON STUDENT ACHIEVEMENT," which
summarizes research that suggests that Abbott was working and cherry-picks Union City to argue that superspending is academically necessary and beneficial.

The ELC's press release begins:
Governor Chris Christie attempts to justify his proposal to take massive amounts of school aid away from NJ districts educating the most disadvantaged students by making claims about student achievement that simply aren’t true.

The Governor says districts with high student need “get a big check from the state every year, [but] they are not making any changes in the way they educate children and they are not showing any increase in success."

The Governor is just plain wrong. The facts show NJ's most disadvantaged students making substantial gains over the last 15 years, and studies have documented the positive connection between increased funding and improved student outcomes.
But the governor is not "just plain wrong" about Abbott ineffectiveness, but he makes a foolish mistake in comparing Abbotts to their charter schools and not poor non-Abbotts.

The Abbotts have a clear cut, immense budgetary advantage. For Abbott Theory to be correct, a clear-cut advantage in spending should drive clear-cut higher academic performance than in districts that don't have Abbott money, but not only is there no clear-cut superiority, there's not even ambiguous superiority. In fact, the Abbotts appear to be doing worse.

And what if my sample isn't statistically valid enough to prove to Abbottists that Abbott superspending isn't effective?  So what.  If the Abbotts have 5% academic superiority for 50% spending advantage, that isn't a strong argument to sustain Abbott.

And finally, what was affordable in the 1990s isn't affordable today.  New Jersey's economy has been stagnant for years and we are one of the country's most indebted states.  

State aid is zero-sum and more money for the Abbotts means less money for every other district including many districts who are just as poor as the Abbotts.

Abbott: Ineffective, Unaffordable, Unfair.


Wednesday, July 20, 2016

The Transformation of State Aid Since 1990


This post is about the transformation of the state aid distribution in New Jersey from the 1989-90 school year up to the present and how the Abbott II decision of 1990 has upended the state's relationship with middle-class school districts.

This is a lengthy post, so I will begin with a few bullet points.

  1. Prior to the Abbott II decision, NJ already had a progressive aid distribution where poor districts got more aid.
  2. Among poor districts, NJ already had a bias in favor of poor urban districts (the future Abbotts) over poor rural and poor suburban districts.
  3. NJ's aid increase has doubled the rate of inflation even though student population growth since 1989-90 has only been about one-third.
  4. From 1990 to 2002 NJ's pension contributions fell from $750 million to $0.  During that time state aid increased by $3 billion, from $2.5 billion to $5.5 billion. 
  5. In per student and inflation-adjusted terms, most New Jersey districts get less aid than they did before Abbott. 
  6. The districts who have lost the most state aid per student are not wealthy districts who could easily fund education with local money; the biggest "losers" are districts who have gained the most population.

Chris Christie was wrong to propose that every district get equal state aid per student, but he is 100% correct that the Abbott System is a major cause of New Jersey's property tax crisis.  ("Major" does not mean "sole").

The Education Law Center says that any attempt to link Abbott to New Jersey's property tax crisis is "scapegoating" the Abbotts, but this is just the Education Law Center insulting the intelligence of the state.

The word "scapegoat," as a verb, means to cast blame onto something that is blameless. People may believe that Abbott funding still has educational merit, but to deny that Abbott funding is a major cause of high property taxes is preposterous because the enormous money given to the Abbotts has been diverted from middle-class, working class, and poor non-Abbotts.

The early 1990s state aid data in this post have not been available online previously.  I got the state aid and enrollment data from the Department of Education via an OPRA request.  I've put everything online here.  See the conclusion of this post for more information about the data.

State Aid in 1989-1990

In 1990, when the landmark Abbott II decision came out, New Jersey's K-12 state aid total was $2,536,074,465, divided amongst 1,076,005 students, so $2,356 per student.

This amount would be $4,330 per student adjusted for inflation.

In terms of a per student average, K-12 state aid in 1989-90 was thus significantly less than it is today.  For 2016-17, $8,031,337,334 in K-12 aid is divided amongst 1.3 million K-12 students, or $6,177 per student.
 
The increase in state aid from 1989-90 to today has vastly exceeded inflation and student population growth.


As you can see, as New Jersey increased state aid in the 1990s we first diminished and then completely eliminated pension contributions.  Thus, in discussing the origins of the Pension Crisis, the surge in state aid must be cited in addition to the sales tax cut of 1992 and Whitman's income tax cut of 1994.

Although the Education Law Center implicitly demands that New Jersey continue the pace state aid increases that occurred in the 1990s and 2000s, the pace of increase was not sustainable.

A Flatter Distribution, but Still Progressive

Aside from being a significantly lower "aid effort," state aid before the Abbott II decision had a flatter distribution than today, meaning poor towns got less and middle-class towns got more.

Yet, contrary to what is sometimes said, the pre-Abbott distribution was clearly progressive and there was already a bias in favor of "urban" districts due to the Kean Administration's attempt to give more aid to districts on the Department of Community Affairs' list of "urban municipalities."

For instance, even before the Abbott II decision came out, Newark got $263.8 million, which was more than all of Bergen County and all of non-Newark Essex combined.  Most future Abbotts got significantly less than Newark did, but they got more money than towns you might call working class and more than non-urban DFG A and B districts.

For example, in 1989-90, Millburn got $476 per student ($875 per student with inflation).  Newark got $5,519 per student ($10,155 per student with inflation), so the ratio of Millburn:Newark state aid was 1:11.  Today Millburn gets $416 per student and Newark gets $14,647, so a ratio of 1:35.

A reasonable person might consider the 1989-90 distribution to be unfair since affluent districts had vastly superior tax bases and could more than compensate for inferior state aid, but the state was still trying to give more to poor districts.


The same pattern exists for Mercer County, where state aid was progressive but flatter than it is now.


What I have never seen discussed before is that there was already a bias in favor of districts the state considered urban.


Amounts are adjusted for inflation.
The Abbotts and Everyone Else

The future Abbott districts got $1,024,840,106 in 1989-90, or 40% of the total.  At the time the Abbotts had about 24% of NJ's students.

In crafting the Abbott decisions, the NJ Supreme Court disregarded analternative aid approach to raise spending in the Abbotts up to a threshold considered "adequate."  Instead, the NJ Supreme Court said that whatever the level of the spending in the DFG I and J districts was, the Abbotts had to be at or above that level.

Since Abbott aid was tied to spending in the DFG I and J districts, the state tried to restrain spending in DFGs I and J.  Jim Florio's original Quality Education Aid of 1990 "shot the suburbs in the kneecaps" by making them pay for pensions, post-retirement health care, and deeply slashed their aid, but suburban pension assumption was reversed and the aid cuts did not (initially) go as deep as what Florio had planned.

Although DFG I and J districts gained virtually no aid, since they were not restrained from spending their own tax dollars, they were still able to increase their budgets and Abbott aid increased more than Jim Florio had wanted.

Thus, Abbott spending more than quadrupled.

First Abbott Aid doubled from $1,024,840,106 in 1989-90 to $2,291,696,951 in 1997-1998, when the Abbotts reached parity with DFG I and J districts.  During those eight years, inflation had only been 29%.

Over the next two decades to 2016-17, Abbott funding would again more than double again, to $5.1 billion (counting Pre-K).  Whereas in 1989-90, the Abbotts got 40% of the state aid total, in the 2010s they get 60% of a much larger total.

The Abbotts got the lion's share of the increase, but poor non-Abbotts did reasonably well during the 1990s.  However, after 2001-02, non-Abbott aid began a multiyear stagnation.


Aid by '90 DFG 1989-90 Aid 2016-17 Aid (counts Pre-K) Percentage Increase
Abbott $1,024,840,106 $5,097,138,421 397.36%
DFG A Non-Abbott $33,026,612 $90,616,671 174.37%
DFG B Non-Abbot $193,413,331 $651,367,836 236.78%
DFG CD $206,432,630 $588,105,998 184.89%
DFG DE $305,697,001 $793,285,540 159.50%
DFG FG $220,873,914 $488,171,679 121.02%
INFLATION 94%
DFG GH $232,498,986 $431,780,101 85.71%
DFG I $196,401,926 $273,268,931 39.14%
DFG J $9,054,787 $12,979,326 43.34%

It's critical to remember that these totals conceal great variation.  Even though DFGs A through FG appear to have gained, there are districts who have lost aid in each of those DFGs, even DFGs A and B. Lawrence Township in Cumberland County was DFG A, but it has lost aid in per pupil and inflation adjusted terms.  Lakewood was in DFG B, but it has also lost aid.

In per pupil terms and inflation-adjusted terms, a majority of NJ districts have lost aid.

Of the state's $5.54 billion increase in K-12 opex aid, the Abbotts have gotten over $4 billion, or nearly two-thirds. Counting construction aid and Pre-K aid, the Abbott increase easily exceeds two-thirds.


The Biggest Losers

I hate to use the word "loser" in the context of any district, but I can't think of another antonym for "gainer" that fits.

The biggest losers in aid per student are NOT wealthy districts like Millburn, Princeton, and Mountain Lakes.  The largest losers in state aid are districts for whom aid has been flat or negative and population growth has been dramatic.

Chesterfield is NJ's biggest loser, since its population has quintupled and its aid has actually dropped. In 1989-90, Chesterfield got $523,570 for 228 students.  For 2016-17, Chesterfield will get $419,983 for 801 students.  

 Adjusted for inflation, Chesterfield has lost 87% of its state aid ($4,225 per student in '89-90, $501 per student for '16-'17)

It's possible that Chesterfield was overaided in 1989-90, but a drop of this magnitude is unacceptable unless there has been a tremendous increase in wealth.

There are in fact about 100 districts in New Jersey that have lost aid in nominal terms and these districts are not all wealthy. Cherry Hill, is the state's biggest loser in nominal dollars. It got $18,222,828 in 1989-90. Now it gets $13,110,005.


Conclusion:

The trend of state aid increases outpacing inflation was never going to be sustainable and New Jersey has to get used to a "new normal" where state aid increases are modest and often lag inflation and student population growth.

The huge surge for the Abbotts is particularly unsustainable.  Given the ineffectiveness of Abbott spending, Abbott aid should be be redistributed to other needy districts.

----

Data Note:

The state aid amounts I got from the DOE were in a very easy to use Excel format, but the enrollment data had to be scanned in manually. Since the enrollment data is formatted in a way that is not machine-readable, I have had to hand copy the data myself. Please excuse any data entry errors and try to focus on the big picture.

Also, the state has changed how it calculates enrollment for districts that have sending-receiving relationships with high schools.  The 1989-90 enrollment numbers I got did not include send-receive kids for whom the district pays tuition, although these students counted towards state aid.  The 2016-17 enrollment figures I have do include send-receive kids.  Because the 1989-90 and 2016-17 enrollment figures for send-receive districts are calculated differently I exclude them from 1989-90/2015-16 per pupil comparisons.