Showing posts with label 2017-18 state aid. Show all posts

Thursday, August 3, 2017

Updated State Aid Disparities for 2017-18


Through the effort of Steve Sweeney, Paul Sarlo, Louis Greenfield, and their allies, the legislature was able to amend Chris Christie's original flat-funding state aid proposal in order to add $100 million to overall K-12 spending and redistribute $31 million from overaided districts to underaided districts.

This is an updated look at 2017-18 state aid disparities.

Sweeney's success reduces the disparities that existed in Christie's original proposal, but compared to 2016-17, the disparities are as large as ever, since underaided districts are the ones that are gaining student enrollment and/or losing tax base and thus their Uncapped Aid increased more than Sweeney was able to increase their state aid.

As always, my original data is from the Department of Education.  They sent me information on enrollment, tax levy, Actual Aid, and Uncapped Aid.  I used those amounts to calculate total deficits or surpluses, deficits or surpluses per student, and aid as a percentage of Uncapped Aid.

As always, I've put updated 2017-18 state aid data online.

The analysis is basically the same as other analyses I've done, but I exclude Interdistrict Choice aid from a district's aid and aid surplus or deficit.  Interdistrict Choice has its own, independent aid formula that is outside of SFRA.  Interdistrict Choice Aid is not subject to redistribution under the present debate, so it is wisest to exclude it from the SFRA aid that districts receive.

Here is a summary:

  • The 377 underaided districts still have a deficit of -$1,965,333,325. This is almost exactly the same as the deficit for 2016-17, when our deficit was $1.93 billion.
  • The 200 overaided districts still have a surplus of $637,776,892. 
  • The net deficit for the state is thus $1.328 billion. 
  • There are 70 districts who are still overaided by more than $2,000 per student. Asbury Park has the largest surplus, at +$10,943. (A $24,348,602 surplus for 2225 students) 
  • There are 118 districts who are still underaided by more than $2,000 per student. Bound Brook's deficit remains the largest, at -$9,546 per student.(a -$17,153,743 deficit for 1796 students.)
  • Hopatcong receives 546% of its Uncapped Aid.  ($11,170,937 out of $2,044,921)
  • Chesterfield only receives 19% of its Uncapped Aid, the worst in New Jersey.  (Chesterfield only receives $821,188 out of $4,224,394 it should get.)
  • Jersey City's surplus is the largest in total terms, at $151,554,542 (Jersey City gets $410 million when it should only receive $258 million). This surplus enables Jersey City to tax at only $116 million on a Local Fair Share of $370 million.
So, as welcome as the late budget changes were, New Jersey still has a long way to go towards fairness.

The above figures include vo-techs, but exclude non-operating districts.

For 2016-17 data, please see Dr. Ken Greene's analysis.

---

See Also this Post on State Aid Disparities under the Governor's Original Proposal


Tuesday, April 18, 2017

The Skews of Capped Aid


Other than the Orwellingly named aid-hoarding mechanism known as "Hold Harmless Aid," the most unfair aspect of New Jersey's School Funding Reform Act is the State Aid Growth Limits, aka "Enrollment Caps."

Due to these limits on how much money a district can gain, the most aid a district can gain is a 10% or 20% of what it got the year previous, no matter how severely underaided it is. 

(Technical Note: due to the cuts of 2010 and how low-aid districts then lost large percentages of their state aid, there are districts who would gain more than 20% from what they get now, however, that is technically due to the mechanism of Adjustment Aid, which overrides the State Aid Growth Limits for districts getting less state aid now than they did when SFRA was passed. Since this is a benign effect of Adjustment Aid, and Adjustment Aid is usually odious aid-hoarding, I prefer not to get into the weeds about it.)

Due to the existence of the Aid Caps and the fact that the Caps are percentage based, the more aid a district already receives, the more aid a district gains in dollars-per-student, which is the real measure of budgetary-tax impact.

(I got Capped Aid and Uncapped Aid amounts via an OPRA request to the DOE.  I've made the data publicly available here)

For instance, the following underaided districts all would be gaining the same amount in percentage terms if SFRA were operating:


But in the all-important dollars-per-student, the amounts the districts are getting are completely different and skewed.


What is unfair about this is that Chesterfield, Bound Brook, Manchester Regional Freehold Boro are New Jersey's most underaided districts against Uncapped Aid (Uncapped Aid = real SFRA full funding).  In percentage terms, Chesterfield does worse than any other district.  For 2017-18, Chesterfield will only get 9.5% of its Uncapped Aid, with Bound Brook (-$10,592), Manchester Regional (-$7,562 pp) and, Freehold Boro (-$8,484 pp) among the worst in dollars per student.

Newark, Paterson, Trenton, and Elizabeth are indeed badly underaided, but not by nearly as much.  Newark's aid deficit is only $3,059 pp, Paterson's is $3,252, Trenton's is $3,003, and Elizabeth's is $3,198.

As a consequence of the percentage-based mechanism of the Aid Caps, new aid under SFRA goes disproportionately to large, moderately underaided districts.


Fortunately, reforming the State Aid Growth Limits (aka Enrollment Caps) is part of Steve Sweeney's state aid proposal.  Unfortunately, no one in the media and few among other politicians understands what the State Aid Growth Limits even are.

-----

See Also:

Friday, March 3, 2017

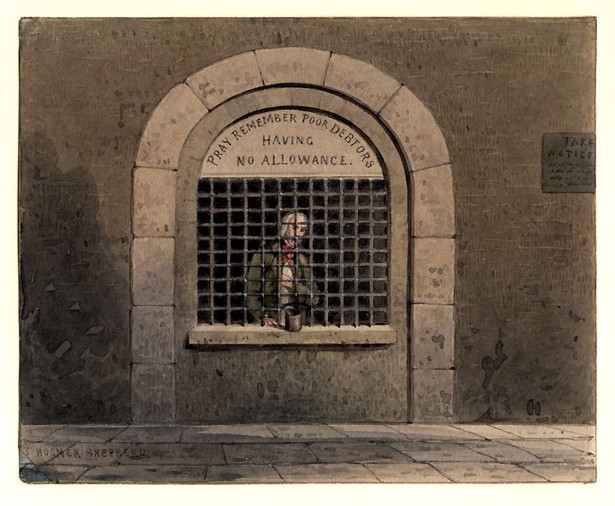
New Jersey=Debtors' Prison: The 2017-18 Budget

Note, this post was accurate at the time it was written regarding flat-funding for K-12 operating aid.  In June 2017 Steve Sweeney pushed through a deal that did increase K-12 aid by $100 million, PreK by $25 million, and Extraordinary Aid by another $25 million.   See this update on disparities for a look after Sweeney's last-minute changes.

Everything in this post I say about categories of debt getting the lion's share of new money remains still accurate. 


The Garden State
For 2017-18 K-12 state operating aid for school districts is increasing by a measly $3,140,585, all of which is going for Interdistrict Choice and Host District Stabilization Aid for Newark.

Of New Jersey's 577 school districts, only 91 are receiving any aid increase at all.

Even New Jersey's most savagely underaided districts, like Manchester Regional, Freehold Boro, East Newark, Chesterfield are gaining nothing.  Bound Brook, who was the most underaided school district for 2016-17, is getting a $6,387 boost, which is for perhaps another Interdistrict Choice student.

Atlantic City, which had lost another $2 billion in Equalized Valuation, gained nothing other than $60,881 for Interdistrict Choice.  This is a contrast to last year, when Atlantic City gained $32 million last year for "Commercial Valuation Stabilization Aid."

Since state aid for 2016-17 was $8,031,337,333, the increase is an imperceptible 4 one-thousandths of a percent.  2016-17 was a bad year too, but at least in that year K-12 aid increased by $90 million.

Yet there is more to this story than just the headline aid increase of $3,140,585 and that untold story is large increases for New Jersey's debt.


  • TPAF funding is increasing by $411 million.  
  • Post-retirement medical funding for teachers is increasing by $69.9 million.
  • Debt Service on Christie Whitman's Pension Obligation Bonds is increasing by $15.4 million.
  • Debt service aid (which goes directly to districts) is increasing by $17.4 million.  

State Debt Servicing, which is for the bonds the Economic Development Authority floated for (mostly Abbott) construction is increasing by $20.5 million from $898.3 million to $918.8 million.

New Jersey's expenses for teachers Social Security is actually falling.  Perhaps this is due the 2016-17 budget cuts meaning that there are now fewer teachers?

Because TPAF and other education debt expenses increased so much, education spending (broadly defined as opex aid and other education-related expenses) is now 39% of the state budget versus only 31% of the budget in 2001. (FY2018 = $13.8 billion out of $35.5 billion)

Click to Enlarge.
Source, pg 41
http://www.nj.gov/treasury/omb/publications/18bib/BIB.pdf


And for comparison's sake, here is where the increase for 2016-17 went.  (the graph refers to "proposed increases," but these proposed increases actually were implemented.)

As you can see, it's the same story.