Showing posts with label State Aid. Show all posts

Tuesday, October 16, 2018

Brick, Toms River, and their State Aid


Since the beginning of Steve Sweeney's efforts to redistribute Adjustment Aid, Toms River and Brick have been two of the most vocal opponents of reform.

The two districts have launched petitions for their Adjustment Aid, initiated lobbying, and now commenced a lawsuit, for which Brick's BOE has already authorized $10,000 and Toms River has authorized $5,000.

Brick and Toms River have depicted the prospect of "only" being funded at 100% as "decimating"
The day of reckoning we have been describing for the last four years is here," [Toms River] Superintendent David M. Healy said. "This year’s state aid losses as well as the future projections will unequivocally devastate this school district in terms of programs, services, staff, class sizes, property taxes, facilities and our ability to provide a thorough and efficient education to our children."
And:
"[Loss of Adjustment Aid] will certainly start decimating our district, starting now."

Brick's Democratic mayor, John Ducey, has just endorsed Chris Christie's already-dead equal funding proposal:

"Why is a kid in another district worth more than a kid here in Brick Township?" Brick Mayor John G. Ducey said Tuesday. "They're not. Every kid should be equally funded. It's just a total abomination of our constitution here in New Jersey."

This blog post will look at Brick and Toms Rivers' tax capacity, loss of enrollment, and then pivot to agreeing with Brick that SFRA itself is not fair to middle-income districts in New Jersey.

Background: 

Despite the aid cuts of 2018-19, Brick and Toms River are substantially advantaged by the state aid status quo.

Whereas the median district is underaided by $417 per student, Brick is overaided by $2,525 per student and Toms River by $1,157 per student.


Brick's 2018-19 state aid surplus is $21,331,456. Toms Rivers' surplus is $17,581,822.

The deficit for the underaided districts is $1.75 billion.

In 2017-18 and before, Brick and Toms River were more advantaged than in 2018-19. Brick's surplus was $2,703 per student and Toms Rivers' was $1,376 per student.

Brick and Toms River Have Low School Taxes

First, Brick and Toms River both have school tax rates that are much lower than the state average.

Whereas New Jersey's average school tax rate is 1.2, Brick and Toms River have tax rates that are approximately 1%, 1.0666% for Brick and 0.9244% for Toms River.

For Brick, the 2018-19 school tax levy is 82.6% of its Local Fair Share. For Toms River, the 2018-19 school tax levy is 78.5% of its Local Fair Share.

The median district in NJ pays 98.5% of its Local Fair Share.

2018-19 Local Fair Share 2018-19 Local Tax Levy Tax Deficit 2018-19 Adjustment Aid
Brick $129,909,386 $107,261,323 ($22,648,063) $21,331,456
Toms River $197,787,405 $155,329,012 ($42,458,393) $17,581,822


Again, the amount of state aid that Brick and Toms River are projected to lose over the next six years is not even equal to the deficit in each district's tax capacity.

Counting municipal and county taxes, neither Brick nor Toms River has high all-in taxes.  Brick's all-in tax rate is 2.058%.  Toms Rivers' is 1.895%.  The state average all-in property tax rate is 2.4%.

Although Brick and Toms River would be rightly concerned about the tax cap, based on the experience of other towns in NJ who exist with higher school taxes, Brick and Toms River are able to pay for a larger percentage of their local schools than they currently do.

Loss of Enrollment, Loss of Equalized Valuation

Both Brick and Toms River have had substantial enrollment loss in last 15-20 years, losing 24% and 15% of their enrollments, respectively.  Although Hurricane Sandy was an enrollment-loss inflection point, the enrollment loss began several years before Hurricane Sandy and is mirrored in other towns in non-metropolitan New Jersey who are not affected by Hurricane Sandy.

Brick's enrollment peaked in 2003-04, at 11,450. Toms River's enrollment also peaked in 2003-04, at 18,192.5.


By contrast, the state's enrollment is only down by 1% since its 2005-2006 peak.

Hurricane Sandy

There's no denying that Brick and Toms River have lost tax base over the last few years, in part by Hurricane Sandy.   From 2008 to 2018, Brick lost 17% of its Equalized Valuation and Toms River lost 10%, compared to the state's average loss of only 6.6%.

HOWEVER, SFRA compensates Brick and Toms River for the loss of tax base, since as a district's Equalized Valuation and Aggregate Income shrink, so does its Local Fair Share.  As Local Fair Share decreases, Equalization Aid increases.

Brick and Toms Rivers' boards of education may decide that their communities do not need to handle paying the state's 1.3% average tax rate, but they have the option of cutting costs.

I do not think that consolidating schools is easy, but it is a prospect in large swathes of New Jersey and at some point it becomes a necessity.

Here Brick and Toms River are actually advantaged because they are very large school districts with 12 and 18 schools, respectively.

Brick is Right About One Big Thing about SFRA

Although I strongly support the redistribution of Adjustment Aid and I believe that Brick and Toms River are in denial about their ability to pay higher local taxes and even consolidate schools, I am in agreement with Brick that SFRA sees Brick as a "wealthy district" when in actuality it is merely middle-income.

"Under the formula, Brick Township is considered a wealthy district."

Without Adjustment Aid, Brick would only receive $12,811,141 for its 8,449 students, which is $1,516 per student.

If you compare Brick's state aid target to the targets of extremely wealthy districts, you can see that Brick is essentially treated as a wealthy district too:


State Aid Target Per StudentLocal Fair Share Per Student
BRICK$1,516$15,376
PRINCETON$1,193$31,619
RUMSON-FAIR HAVEN REG$1,204$27,539
PARAMUS $1,214$27,706
HOBOKEN $1,207$79,106
SPRING LAKE BORO$1,411$166,397
AVALON $2,041$1,935,039
OCEAN CITY$1,127$65,703
FLORHAM PARK $1,126$32,272
MILLBURN $1,125$35,462

I'll compare Brick to Princeton, since Brick has complained about Princeton gaining state aid while it
Avalon is NJ's Richest District in Tax Base Per Student, so
Why on Earth does Avalon, NJ Need $2041 Per Student
in State Aid?
loses state aid, although Princeton is not even close to being NJ's wealthiest district (which is Avalon).

Brick's median household income is $70,655. Princeton's median household income is $118,467.

Although Brick's $1,516 state aid target might be 27% higher than Princeton's in percentage terms, it is only dollars per student that is budgetarily meaningful. 

Brick's $323 superior state funding per student relative to Princeton is very little additional state support in terms of the overall budget.  

To put it another way, Princeton is supposed to fund 92.4% of its Adequacy Budget with local taxes; Brick is supposed to fund 90.6%. 


To put it another way mathematically, SFRA expects Princeton to tax itself at $14,478 per student. It expects Brick to tax itself as $14,692 per student, even though Brick has nowhere near Princeton's wealth. In actuality, Princeton taxes itself at $19,825 per student because it wants to have higher spending.  (and that amount is nowhere near Princeton's Local Fair Share.)

What Brick is complaining about is a statewide problem. For 2018-19, 44% of NJ districts are not supposed to receive Equalization Aid. All in, there are 269/588 districts in NJ are that are supposed to receive less than $2,000 per student.

The reason we haven't heard about how inadequate SFRA's target is for middle-class districts is because most NJ's middle-class districts are underaided compared to their SFRA target anyway, and so for them to get even $1525 per student like Brick is supposed to get would be an improvement.

I will write a future post on making NJ school funding fairer to middle-class districts.

The Bottom Line is that NJ Can't Afford Adjustment Aid

Brick and Toms River aren't wealthy enough to just shrug off the loss of Adjustment Aid, but the bottom line is that they can afford to pay the same tax rates that other non-wealthy towns pay.  I acknowledge that it will be damaging to pay more in taxes, but Brick and Toms Rivers' taxes are artificially low due to the involuntary generosity of taxpayers in the rest of New Jersey.  It would be nice if NJ had a state aid law that helped middle-income districts, but given that we don't, it's inherently unfair to treat some middle-class districts differently than other middle-class districts.

NJ does not have a budgetary choice but to redistribute state aid.  For 2018-19, the state aid deficit for the 370 underaided districts was $1.74 billion and that continually grows.

Although 2018-19 Adjustment Aid was technically $652 million, at least $50 million of that is already roped off from redistribution because it goes to vo-techs or districts with very high municipal taxes.

Given NJ's intensifying needs to fund teacher pensions, post-retirement medical, and other debts, the state cannot create equity in K-12 school funding by increasing state aid alone and redistribution has to be part of the solution.

Redistributing state aid does mean some districts must lose state aid, but these districts will only be reduced to 100% of their recommended funding.  When NJ has 370 districts who are currently given less than 100% funding, I have a hard time seeing the unfairness of that.

-----

See Also:


Tuesday, March 13, 2018

Tentative Reaction to Murphy FY2019 Budget Proposal

UPDATED STATE AID ANALYSIS IS HERE

On Tuesday, March 13th, Phil Murphy gave his first budget address.

The budget address gives the amount of money Phil Murphy wants the state to spend in various categories.  It does not include the amount of state aid every district will get.  District-specific data will come out two days later, on Thursday, March 15th.  Murphy's speech is, by necessity, light on details, but more information is available in the FY2019 "Budget in Brief."

The budget assumes $1.7 billion from various tax increases that the legislature may not approve.  These tax increases of uncertain fate include raising the top income tax bracket to 10.75% (+$765 million), raising the sales tax to 7.0% and broadening it (+$581 million), "modernizing" corporate taxes (+$110 million), and taxing marijuana (+$80 million).  It also assumes savings from various health benefits reforms (- $118.7 million).

Despite the large increase from natural revenue growth and tax increases, Phil Murphy only proposes increasing K-12 aid by $283 million, saying that this will bring New Jersey to "full funding" in four years.

Update: Uncapped Aid is available here.


Reactions:
Murphy Spreads Confusion Over the Size of the Deficit
As before, Murphy is pretending in public that SFRA's deficit is only $1 billion, despite the existence of the State Aid Growth Limits that reduce the amount of aid a district can gain in a year.

Buried in the "Budget in Brief" is a tacit admittance that there is a difference between the statutory deficit (using that term) and the real, Uncapped Aid deficit, "This budget represents year one of a four-year ramp-up to full statutory funding that will ensure every public school district has the resources needed to provide all of New Jersey’s children with the excellent education they deserve." (see page 9)

As welcome as this (obscure, tacit) concession is, the statute of SFRA itself is extremely flawed, since new aid is based on a district's existing aid, not the district's deficit, thereby giving the most underaided districts the smallest increases.

Moreover, Capped Aid is itself supposed to be an incremental target, so by setting a four-year ramp up to that, Murphy is creating a series of incremental steps to what is supposed to be an incremental target.

It would be extremely unfair to make districts who are getting less than 50% of their Uncapped Aid to wait four years just to get a 10% or 20% increase in what they get now.

Also, Murphy's FY2019 budget depends on new revenue from various tax increases and uses additional revenue from a temporary income tax surge NJ is enjoying. Since Murphy cannot pass a tax increase every year, and the income tax surge will taper off, this means that Murphy will not have enough money to increase K-12 aid by ~$280 million per year for the next three years.


This means that it is all the more important to phase-out Adjustment Aid and start doing it NOW.

A Wide Distribution of New Aid = Less Help for the Severely Underaided

If 94% of districts are indeed gaining state aid and only 65% of NJ's districts are underaided, then Murphy is increasing state aid for numerous districts who are already overaided.  We won't know until Thursday what exactly he is doing, but it may be that he is undoing the cuts to Adjustment Aid that occurred in 2010, 2013, and 2017.

More of the State's Money is Going to Education Than Ever Before

The percentage of the state's budget going to education is at an all time high of 40% - $14.95 billion out of $37.4 billion.  (that includes lottery money)

In FY2018 education spending was 39.6% of the budget. In 2001 education spending was only 30% of the budget.

$14.95 billion for New Jersey's 1,373,267 students works out to $10,886 per student, an amount that is nearly equal to the national local+state+federal school spending average of $11,392 per student.

Municipal aid is being flat-funded, with a $12 million increase, from $1.524.2 billion to $1.536.2 billion. That is a 0.8% increase, which is much less than inflation. (see page 17 of the BIB)

Huge Increase for School Construction (Probably for the Abbotts)

The $148.3 million increase in school construction money is much larger than the previous two years. For FY2018 school construction debt service only increased by $20.5 million; for FY2017 school construction debt service increased by $52.1 million.

I don't know exactly why there is going to be a tremendous increase in construction debt service. It was not predicted in recent State Debt Reports, so it is likely that Phil Murphy plans another round of Abbott construction bonding.

Tens of Millions for PreK and "Free" Community College, Flat Funding of Extraordinary Aid

There is no increase in Extraordinary Aid. Extraordinary Aid is being flat-funded at $195 million.  (Extraordinary Aid is the state's reimbursement for Out Of District tuition for students with special needs)

Flat-funding of Extraordinary Aid will be devastating for Lakewood.

Flat Funding, in Per Student Terms, for Higher Ed
This budget continues the long process of abandoning NJ's middle class by neglecting higher ed.

Higher Ed funding (outside of communities colleges) is only increasing by 3%. In per student and inflation-adjusted terms, that's flat funding at best.

NJ's higher ed funding as a percentage of the budget is probably falling to new low.

---

See Also

Saturday, December 2, 2017

How Maryland Does It: How Another Deep-Blue State Has Much Lower Property Taxes than New Jersey


Every once in a while I meet an advocate for school district consolidation in New Jersey who uses Maryland as a beacon state for us to emulate, since Maryland's schools are just as high-performing as New Jersey's, less segregated, and significantly lower spending (and taxing).

Indeed.  All of that is true.

If you could magically transport your typical New Jersey house to Maryland, your property taxes would fall from $8,477 to only $3,437.  Your other taxes would be lower too: Maryland's sales tax is 6% compared to our 6.875%.  Maryland's corporate tax is 8%, instead of 9%, too.

For state and local taxes combined, Maryland takes in less than New Jersey.  Maryland's taxes equal 10.9% of income, whereas New Jersey's taxes equal 12.2% of income.  To put it in terms of dollars per capita, Maryland's state and local taxes are only $5,920 per person.  New Jersey's are $6,926.  (see Table 2; corroboration E-1 to E-4)

Paradoxically, you get more for your taxes in Maryland for some services.  If your kids went to a public college they'll have less debt than their peers in NJ, since Maryland's public higher education system gets 42% more money per capita than New Jersey's.  Maryland lets people take out 529 profits tax-free. If you lose your job, Maryland's property tax "circuit breaker" will reduce your property taxes. You'll have the satisfaction of knowing that your state's bond rating is AAA, so you might feel more confident investing in Maryland too.

So how are Maryland's taxes so much lower?

The most obvious difference between Maryland and New Jersey is that Maryland has only 24 countywide districts whereas New Jersey has 586 town-based districts, but Maryland's school district consolidation versus New Jersey's fragmentation is just the tip of the iceberg as to why Maryland has lower property taxes than the Garden State.

The direct savings of Maryland's district consolidation - ie, less redundancy in administration - are minimal.  It is in the indirect savings created by Maryland's consolidation - ie, less intense interdistrict spending competition - that produce the real savings.

This blog post will look at two under-discussed, and more significant, reasons why Maryland's property taxes are lower than New Jersey's:
1.  Maryland localities have their own income taxes.
2.  Maryland spends 22% less per student.
    a.  That lower spending is across-the-board.
        i.  There are several structural and political reasons for that lower spending.
 
A subsequent post will look at a third major reason:
3.  Maryland gives more state aid to middle-class districts than New Jersey does.

-----------

The source of revenue doesn't make a district higher spending or lower spending, but technically speaking, one reason Maryland's property taxes are lower is because counties have a significant alternative source of revenue.

1.  Maryland Localities Have Their Own Income Taxes

Maryland's average property tax rate is only 1.05, compared to New Jersey's 2.40.  The Maryland jurisdiction with the highest property taxes, Baltimore City, only has a property tax rate of 2.248, which is below New Jersey's average.  The Maryland jurisdiction the lowest property tax rate is Talbot County, which has a rate of 0.547.

New Jersey's property tax average is 2.4.  Irvington, the New Jersey town with the highest all-in property taxes has a 4.9 rate, which is nearly five times Maryland's average. 

Maryland's 1.05 average property tax is a lower tax rate than even the richest towns in New Jersey have.  Millburn's tax rate is 1.8.  Princeton's is 2.0.  Madison's is 1.7.  Franklin Lakes's is 1.5.  Even Hoboken, with its $5.5 million in Adjustment Aid and proportionally small student population, still has a 1.3 tax rate.  The only NJ towns in NJ with property taxes lower than 1.05 are resort towns at the Jersey Shore and wealthy enclaves like Alpine and Harding.


Maryland's county income taxes range from 1.75% to 3.2%, with 3.0%
Source,  pg 28 
as the median.  Baltimore City, mentioned above for its high property tax, has a 3.2% income tax, so you would pay higher local taxes in Baltimore City than you would in most of New Jersey.

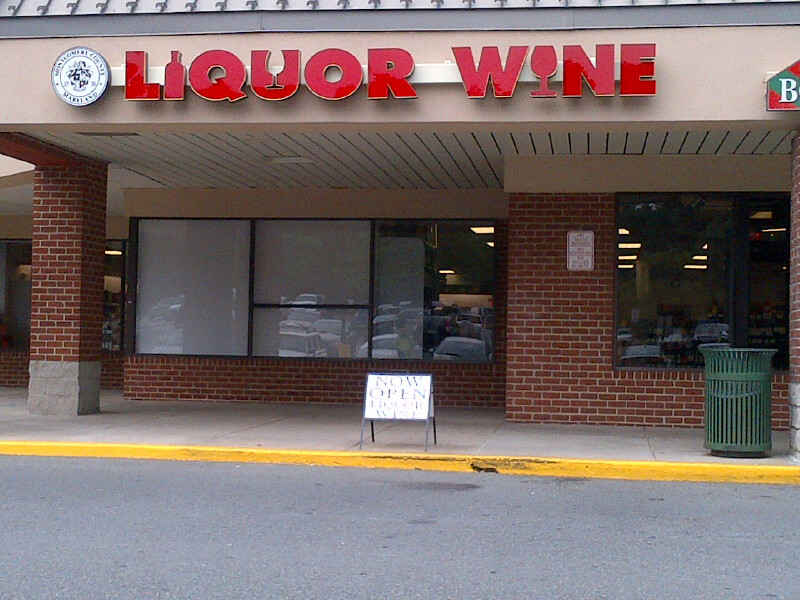
On average, Maryland localities get 34.8% of their taxes from income taxes, 53% from property taxes, and then 12% from "other taxes."  (ie, liquor stores)

Aside from Baltimore City, Maryland's property taxes are so much lower than New Jersey's that most New Jerseyans would come out ahead despite the local income tax.  A 3% median income tax is real money, but since Maryland's average property tax is $5,000 lower than New Jersey's, a family would have to make over $166,000 a year before it would pay higher Maryland local taxes than it would in New Jersey, assuming it lived in average-value houses.  Since families making over $166,000 in New Jersey probably live in more expensive-than-average houses anyway and pay higher than the $8,477 average in property taxes, the crossover income point would be higher than $166,000 per year, unless those

families had lived well below their means back in Jersey.
Above, a Montgomery County Liquor Store


Maryland's state income tax brackets are  higher for people at low-incomes, but lower at average to
above-average incomes.

Maryland taxes income $4,000-$100,000 at a 4.75% rate.  New Jersey has lower rates for low income filers, but NJ starts taxing at 5.525% at only $40,000 a year, then 6.37% at $75,000, and then at 8.97% $500,000.

Maryland's top bracket, 5.75%, kicks in at $250,000.  Because Maryland's second-highest and higher brackets are so much lower than NJ's, Maryland collects less in income taxes per capita than NJ ($1,297 p capita versus $1,361 per capita) and Maryland's system is less reliant on its top 1%.

In terms of all state taxes, Maryland captures less than New Jersey, $3,172 per capita versus New Jersey's $3,325 per capita. (see E-12)

How Maryland developed an income tax-based system whereas New Jersey developed a property tax-based system is complicated, but Maryland had a forty year head start on NJ in state income taxes, enacting its own income tax in 1937, whereas New Jersey held out until 1976.  Maryland also enacted a sales tax in 1947, whereas New Jersey didn't enact a sales tax until 1966.

2.  Maryland's Taxes are Lower Because School Spending is 22% Lower than New Jersey's

Maryland's property taxes are lower than New Jersey's because it has local income taxes, but another major factor is that Maryland's PreK-12 schools spend so 22% less per student than New Jersey's. New Jersey's spending is $21,243 per student, compared to Maryland's $16,985 per student, a difference of $4,258 per student.  (see Table F-1)

If New Jersey spent as much as Maryland on PreK-12 schools, we would save $5.9 billion.  At savings at that level, we would have no pension crisis, no NJTransit crisis, no underfunded higher ed, and have enough money left over to lower taxes.

Source, NEA Rankings & Estimates, Table F-1, 2016.
http://www.nea.org/assets/docs/2017_Rankings_and_Estimates_Report-FINAL-SECURED.pdf


Maryland's spending is also significantly lower in terms of spending as a percentage of State GDP.

Source, Figure 3.  "Median" refers to the national median.
https://drive.google.com/file/d/0BxtYmwryVI00VDhjRGlDOUh3VE0/view

Maryland's lower school spending exists despite its cost of living being the same or higher than New Jersey's. 

There isn't a federal ranking of states by cost of living, but many independent organizations put out their own rankings. The respected MERIC ratings rank Maryland's cost of living as higher than New Jersey's. The Council for Community and Economic Research agrees and ranks Maryland higher in cost of living too.

Some sources rank New Jersey's cost of living higher, but the difference in cost of living is not proportional to the difference in school spending.  For instance, the Tax Foundation says that $90.66 in Maryland would only buy $87.34 worth of the same goods and services in New Jersey.  That's a difference, but not something that accounts for a 22% difference in school spending. Giving the closeness in the two states' cost of living, New Jersey's high education spending is due to political-judicial preference, not economic necessity.

Some would consider lower school spending a negative tradeoff, but Maryland's education performance is as high as New Jersey's, despite much lower spending.   Since Maryland's schools perform about as well as New Jersey's (topping Education Week's rankings six years in a row), I would not consider the lower spending a tradeoff except in that Maryland offers less public PreK.

(It's worth pointing out that more Maryland children attend private school than New Jersey children.  Only 85% of Maryland children attend public school, versus 89% of NJ children (see Figure 5)

2a.  Maryland's Spending is Lower than NJ's Across the Board

Many people attribute Maryland's lower spending to having fewer school districts, and thus less administration.
  • Maryland has 24 school districts for 874,514 students, or one district per 36,438 students.
  • New Jersey has 590 school districts for 1,347,166 students, or one district per 2,283 students.
That's a huge difference and yes, Maryland's administrative spending is lower, but Maryland's spending is lower almost everywhere.

Source: Table 7
https://www.census.gov/library/publications/2017/econ/g15-aspef.html

So Maryland's General Administration is $236 per student lower than New Jersey's.  Maryland's lower General Administrative spending would translate to savings of $328 million, which is a large amount, but only a fraction of the NJ/MD spending difference.

Attributing Maryland's lower taxes to district consolidation and administrative efficiency is correct, but highly incomplete.

The most financially significant difference between Maryland and New Jersey is that Maryland has fewer teachers.  NJ has 112,377 teachers, so a student:teacher ratio is 11.9:1, the second lowest in the US.

Maryland has 60,053 teachers, so a student:teacher ratio is 14.6:1, the 30th lowest in the US.

On top of Maryland having fewer teachers, it pays them less well, at an average salary of $66,456 versus New Jersey's $69,330.

I think the more significant relationship between having big districts is that those districts are socioeconomically diverse, and therefore there are no rich districts like in New Jersey to bid up salaries which middle-class districts end up struggling to match.  IE, Maryland does not have a "Millburn-Princeton Effect."

From an education point-of-view, Maryland's having fewer teachers and then giving those teachers lower salaries is a negative, but from a taxpayer point-of-view, having fewer teachers and lower salaries is a positive. 

i: there are many reasons for MD's lower spending

Why Maryland has lower school spending is a very complex matter, but I think the following are major reasons.

1.  Maryland's teacher unions are less powerful than New Jersey's.

Maryland only gave teacher unions the power to impose agency fees in 2013, and this law hasn't gone into effect statewide because there are counties where too few teachers want to actually join the union to trigger implementation.

New Jersey gave its teacher unions the power to impose agency fees wayyyyy back in 1979.

The newness of mandatory agency fees means that union fees in Maryland have not climbed as high as they have in New Jersey.  In 2014-15 the Maryland State Education Association had a budget of $21.6 million.  By contrast, the NJEA had a budget of $134.4 million.

It is perhaps due to the NJEA's superior power that New Jersey teachers have post-retirement healthcare coverage, which doesn't exist statewide in Maryland.  It is perhaps due to the NJEA's superior power that pensions in NJ are 100% a state obligation, versus a hybrid state-local obligation in Maryland.  It is perhaps due to the NJEA's superior power that NJ pours so much more into PreK-12 education aid than it does into higher education.

2.  Maryland has Far Fewer Students in Out-of-District Placement

New Jersey leads the nation in the percentage of special education students who are in out-of-district placement.  Maryland's placement rate is also above the national average, but barely half of New Jersey's.

According to the most recent data I could find, 0.9% of NJ students are in Out-of-District placement, the highest of all states, versus only 0.47% of Maryland students, which is itself the 6th highest of states.

I do not have data for Out-of-District placement total costs, but the spending difference must be in the hundreds of millions, both for tuition itself and transportation.

Maryland's having large districts may make feasible for districts to create specialized programs for kids that New Jersey's small districts cannot create, however, in Maryland the legal burden-of-proof is on the parents to prove that an in-district program is inadequate, whereas in New Jersey the legal burden-of-proof has been on the district to prove that a program is adequate.

In other words, in Maryland if there is a parent-district special education dispute, the special education program is assumed to be adequate, but in NJ if there is a dispute the special education program is assumed to be inadequate.  Thus, it is very hard for a New Jersey district to win a lawsuit against parents who want their child in a private-school setting.

When a New Jersey district loses special education litigation, the district pays the other side's legal fees, thereby incentivizing the district to accede to the parents' demands before litigation begins.

3.  Maryland does not have a "Princeton-Millburn Effect."

This is the large indirect benefit of having large, diverse districts.

Maryland has many rich towns, but it has no rich districts.  If Maryland's rich towns like Chevy Chase, Potomac, Bethesda, and Ocean City had independent school districts they would surely spend huge amounts of their own money on their own children, but all of those towns are subsumed into big, diverse countywide school districts and therefore they can't spend as much as what Princeton, Livingston, Franklin Lakes, Millburn etc can.

The highest-income school district in Maryland is Howard County, whose median income is $110,238.  That's pretty affluent, but but only 3.1x higher than Maryland's poorest school district, Somerset, whose median income is $35,154.  (see pg 96)

New Jersey has over 40 school districts with a higher median income than Howard County, and our ceiling is closer to $200,000 per year than $100,000.

By contrast, the richest K-12 school district in NJ (by income) is Millburn, whose income is $158,888, an amount that is 5.6x higher than Camden's $28,000.

The richest district in Maryland by tax base per student is Worchester County (on the Atlantic Ocean), but Worchester is only 4.1x richer than Maryland's poorest district by tax base, Caroline County.

Likewise, New Jersey's tax base differential is wider too.  Millburn's tax base per student is 18.6x higher than Camden's, but Millburn's tax base is nothing compared to microdistricts at the Jersey Shore.  Deal, which was cited in the Robinson v Cahill decision as an example of tax rate injustice, has a tax base per student that is 6.5x Millburn's and 121x than Camden's.

Even though Maryland and New Jersey are peers in income on a statewide basis, Maryland has no rich districts like New Jersey has.  One Maryland education expert I talked to said that Montgomery County had more salary competition against Washington, DC than it did against any other county in Maryland. 

In New Jersey, the existence of relatively small, affluent, high-spending districts like Princeton and Millburn has driven up overall education spending through what I will (semi-facetiously) call the "Princeton-Millburn Effect."

(Note: Millburn's spending has always been much lower than Princeton's, even though Millburn is wealthier.)

Residents of New Jersey's affluent districts have several reasons to accept higher taxes.
  1. First, high taxes in small towns give concentrated benefit to the children of that town, whereas in Maryland having big districts means that the benefits of high-spending are diffuse and that extra money may even go to high-poverty schools within that county.  
  2. Second, many people in high-income districts sincerely believe that high-spending = good schools and good schools= higher property values for that town, whereas in Maryland people would be less likely to believe this due to how large districts are and how diffuse any higher spending would be.
Since New Jersey has stronger interdistrict competition in teacher salaries and school services than NJ, affluent high-paying districts of New Jersey have bidded up salary scales statewide.

Indeed, even in the 1970s, New Jersey's property taxes were larger than all state revenue.  In 1990, before the Abbott II decision transformed NJ state aid, New Jersey's all-in property tax rate was 2.0, a figure I believe was the highest in the US.

The secondary Princeton-Millburn Effect is through compensatory state aid, since the existence of high-spending, affluent districts has forced the state to devote massive amounts of income tax revenue to state aid for the Abbott districts in order to equalize spending with affluent suburbs.  By 2006, 22 of the country's 30 highest spending districts in the United States were Abbotts and New Jersey had a U-shaped spending pattern, where poor, urban districts and affluent towns spent the most.  High-spending in the Abbotts added to other districts' upwards pressure on spending.

4.  In Maryland County Councils and Executives Set School Taxes, Not Boards of Education

Maryland school districts are "dependent districts," meaning they do not have their own taxing authority.

Maryland school districts get their money from the county governments they are part of.  The county council and executive determine how much money the school districts will have, not the Boards of Education.

County councils, I would think, would be more taxpayer-sensitive than Boards of Education are, who see their primary responsibility to do what is best for students, not taxpayers.


----------
Part 2: State Aid


Maryland has lower taxes on its middle-class residents because Maryland's middle-class districts get more state aid than their equivalents do in New Jersey.

State aid is a highly complex subject in which interstate comparisons are tricky.  New Jersey has more streams of indirect aid than Maryland does and New Jersey state aid is badly off-formula.  Part 2 of this series addresses state aid.


Monday, October 24, 2016

Vincent Prieto Proposal for SFRA II

For years, the loudest silence on state aid has been from Assembly Speaker Vincent Prieto.

Aside from vocational education, Prieto leaves education legislation to other people.  His references to state aid fairness have been nonexistent.

Although most of the legislature, frankly, ignores state aid, Prieto's indifference to state aid is hard to accept because his own District 32 in Hudson and Bergen counties is savagely underaided.

Red indicates Abbott.


So Vincent Prieto's entry into the state aid battle is welcome after years of neglect, but that doesn't mean that Prieto's ideas actually are good ones.

As Prieto wrote with Assemblywoman Marlene Caride in the Star-Ledger on October 24th:
We also recognize New Jersey has not properly funded its schools. It's a longstanding problem that should have been resolved years ago, but remains festering due to economic struggles and political ideology. 
The status quo is unacceptable, but the ideas proposed by Gov. Chris Christie and another approved by the Senate are unacceptable options. 
That brings us to the Joint Legislative Committee on Public School Funding Reform, our proposal to fairly fund schools in our state free of politics and ideology.
Free from politics and ideology?  Excuse me?  How is that possible? There isn't a single person in the edusphere who isn't ideological and the subject of state aid is no exception to that tendency.  Some people worry more about taxes than others; some people worry more about inequity; some people want teachers to be much higher paid.  Everyone with an opinion on state aid is ideological to some degree.  

Anyway, here is the proposal for "SFRA II"
This commission would be modeled after the [PJP - Professional Judgment Panel] 2006 committee that devised the current school funding formula, the first school funding plan deemed constitutional by the New Jersey Supreme Court in nearly 30 years.
The main problem has been the state's failure to fund it. The provisions have been ignored and overridden.

We believe this is still the model, but it's been 10 years, so we can now take a look back at what was right and wrong with that formula....
The committee will review the School Funding Reform Act of 2008 and formulate proposals that address problems and issues that have arisen since the enactment of the law, including issues associated with changes in the demographics and fiscal conditions of districts that have impacted the ability of local communities to support the education of their students.
The 2006 committee availed itself of the expertise of numerous stakeholders. We would expect this committee to do no less. The legislation would create a public school funding reform working group comprised of 12 members from expert education organizations across the state. This working group would serve in an advisory capacity and as a resource for committee deliberations.
No part of the school funding formula or the processes associated with the formula would be off limits. We expect the committee to look at all problems and issues that have arisen in the past 10 years, as well as demographic changes and changes in the fiscal conditions of school districts.
We want a realistic proposal that can be fairly funded annually.
One particular area that we hope will get special attention is preschool opportunities — a proven indicator of future educational success. We also hope the committee will focus attention on funding for special education.

Ok. I'm not enamored of the SFRA PJP committee>legislative amendment process.  According to Chris Cerf, the legislature arbitrarily increased the Professional Judgment Panels' recommendation for weights for at-risk students and created "Adjustment Aid" out of nowhere.

Although Prieto doesn't rule out cutting or eliminating Adjustment Aid, any formula that Prieto's "Joint Legislative Committee on Public School Funding Reform" comes up with will primarily rely on new money for K-12 education and if the next governor decides to prioritize things other than K-12 education or there is a recession, Prieto's "SFRA II" will fail just like the original SFRA did.

Prieto's suggestion that the state put more money into Pre-K education may or may not have merit, but budgeting is a zero-sum game and putting more money into Pre-K would subtract from money for K-12, higher ed, pensions, senior tax rebates etc etc etc.  If Pre-K is provided by public schools themselves, in the long run, Pre-K even increases the state's pension liabilities since Pre-K teachers are pension-eligible public employees.

Pre-K itself is incredibly expensive, around $13,500 per student.  To provide Pre-K to the 50,000 students who are statutorily eligible for it under SFRA would cost nearly $700 million.
Source:
http://bit.ly/2eCFTWE

Although Vincent Prieto has said he would "love a millionaire's tax," increasing rates on high incomes is enough. In 2014, raising the 8.97% top rate to 10.75% on income over $1 million would only have brought in $565 million.  A 2015 version that would also have raised business taxes by 15% would only have brought in $1.1 billion.

$565 million isn't enough.  $1.1 billion would be a good deal more helpful, but it would make our corporate taxes the country's second highest (after Iowa's 12% top rate).  Since New Jersey's other taxes are the highest in the country or among the highest, making our corporate taxes #2 is insane.


The state's debt and pension payments alone increase by nearly $1 billion a year, in some years increasing faster than the state's revenue growth, so the hope we might "grow our way" out of the budget mess is far-fetched.

Prieto is also wrong about why Congress hasn't reopened the base closing process.  Congress hasn't reopened that because it doesn't like the idea of an empowered committee, it hasn't reopened that because it doesn't want to close any more based. Period.

Anyway, I'm glad that Prieto is finally talking about state aid and not ruling out redistribution, but I wish it were something that put redistribution front and center and addressing other problems, such as the state aid growth limits and PILOTing.

---

See Also:


Wednesday, September 21, 2016

NJ Auditor's Report Finds Deep Flaws in State Aid

MUST READ


NJ's Auditor has come out with a report on school funding and admits what we already know: that state aid appropriations bear no relationship with SFRA recommendations, tax base, or current student demographics.

Funding is not based on current district data.
The SFRA formula distributes aid based on district enrollment and student demographics  (income, special education, language barriers, etc.), as well as other factors such as district  wealth and property values. In fiscal years 2015 and 2016, funding remained static for each district at the fiscal year 2014 funding level for SFRA formula aid categories (with the exception of School Choice and Preschool Aid). Changes in districts’ enrollments, student demographics, and other factors influencing aid were not considered.

The SFRA formula aid has not been distributed per statute since fiscal year 2009. Starting in fiscal year 2010, the Appropriations Acts began superseding part, or all, of the formula.  Through fiscal year 2014, the methods followed for the annual calculations blended past and  current data from multiple years to determine funding, making the distribution convoluted. During fiscal years 2015 and 2016, no data from either year was applied to the formula to determine funding. Consequently, there were significant differences between actual funding and what the SFRA dictates.
I was encouraged to see that the report criticized Adjustment Aid, even though Adjustment Aid is part of SFRA:

Additionally, it should be noted that even though the SFRA formula aid was not distributed in accordance with statute, districts may have received Adjustment Aid. This aid is provided so districts do not receive less aid than their fiscal year 2009 amount. In addition, in fiscal year 2014, Additional Adjustment Aid was distributed per the Appropriations Act to ensure districts would not receive less than their fiscal year 2013 funding. Adjustment Aid and Additional Adjustment Aid can be contrary to the objective of the SFRA since funding may exceed the districts’ actual needs for their current student populations.

More originally, the report claims that SFRA's formula for Special Ed Aid, which assumes that every district in NJ has a 14% classification rate, does not work for scores of districts:

"Our review of districts with 100 or more special education students in fiscal years 2015 and 2016 found that 234 districts (59 percent) and 258 districts (64 percent), respectively, had an actual classification rate that deviated more than 10 percentage points from the statewide average classification rate of 14.78 percent. As a result, district funding is not commensurate with actual enrollment of classified students in many instances."

The report also found that every district getting PreK aid OVERestimated its enrollment.  The overestimates result in an extra payment of $32.9 MILLION.

Our review also noted that every district overestimated their projected enrollment in fiscal year 2015, resulting in overpayments to 32 districts totaling $25.7 million. In fiscal year 2016, 33 districts overestimated their projected enrollment, resulting in 30 districts being overpaid a total of $32.9 million. However, using actual enrollment data, we determined that seven and ten of the SDA districts in fiscal years 2015 and 2016 would still have been held harmless to their fiscal year 2009 funding, resulting in additional overpayments of $10.9 million and $28.2 million, respectively.

The report revealed something I did not know, which is that Abbott districts have been "held harmless" for PreK aid and not just K-12 aid.  This means that if an Abbott districts has fewer PreK students now than it had in 2008, it gets the same amount of money it got before.

The SDA [Abbott] school districts are held harmless to fiscal year 2009 thresholds. They will receive the greater of their calculated fiscal year 2015 or 2016 Preschool Education Aid, as explained above; the amount of aid they received in fiscal year 2009; or their fiscal year 2009 per pupil amount multiplied by their current year total projected enrollment. During our audit period, seven SDA districts were held harmless providing them with $11.8 million and $16.5 million in excess funding for fiscal years 2015 and 2016, respectively.  [my emphasis]
The report also demonstrates disparities in Pre-K aid that are rarely covered:


Districts can operate full-day, half-day, or a combination of both for their preschool programs. The [Early Childhood Program Aid] per pupil amounts are based on full-day preschool programs. Students attending half-day programs receive half of the per pupil amount for each enrolled student. We noted that the per pupil amounts for the 93 districts ranged from $2,036 to $27,663. This disproportionate funding creates educational inequities among the students being served by this aid. 
The DOE response is included.  The DOE concurs with all recommendations except the one for Specia Education.  The DOE says it is working to make Pre-K distributions match enrollment.

Wednesday, July 20, 2016

The Transformation of State Aid Since 1990


This post is about the transformation of the state aid distribution in New Jersey from the 1989-90 school year up to the present and how the Abbott II decision of 1990 has upended the state's relationship with middle-class school districts.

This is a lengthy post, so I will begin with a few bullet points.

  1. Prior to the Abbott II decision, NJ already had a progressive aid distribution where poor districts got more aid.
  2. Among poor districts, NJ already had a bias in favor of poor urban districts (the future Abbotts) over poor rural and poor suburban districts.
  3. NJ's aid increase has doubled the rate of inflation even though student population growth since 1989-90 has only been about one-third.
  4. From 1990 to 2002 NJ's pension contributions fell from $750 million to $0.  During that time state aid increased by $3 billion, from $2.5 billion to $5.5 billion. 
  5. In per student and inflation-adjusted terms, most New Jersey districts get less aid than they did before Abbott. 
  6. The districts who have lost the most state aid per student are not wealthy districts who could easily fund education with local money; the biggest "losers" are districts who have gained the most population.

Chris Christie was wrong to propose that every district get equal state aid per student, but he is 100% correct that the Abbott System is a major cause of New Jersey's property tax crisis.  ("Major" does not mean "sole").

The Education Law Center says that any attempt to link Abbott to New Jersey's property tax crisis is "scapegoating" the Abbotts, but this is just the Education Law Center insulting the intelligence of the state.

The word "scapegoat," as a verb, means to cast blame onto something that is blameless. People may believe that Abbott funding still has educational merit, but to deny that Abbott funding is a major cause of high property taxes is preposterous because the enormous money given to the Abbotts has been diverted from middle-class, working class, and poor non-Abbotts.

The early 1990s state aid data in this post have not been available online previously.  I got the state aid and enrollment data from the Department of Education via an OPRA request.  I've put everything online here.  See the conclusion of this post for more information about the data.

State Aid in 1989-1990

In 1990, when the landmark Abbott II decision came out, New Jersey's K-12 state aid total was $2,536,074,465, divided amongst 1,076,005 students, so $2,356 per student.

This amount would be $4,330 per student adjusted for inflation.

In terms of a per student average, K-12 state aid in 1989-90 was thus significantly less than it is today.  For 2016-17, $8,031,337,334 in K-12 aid is divided amongst 1.3 million K-12 students, or $6,177 per student.
 
The increase in state aid from 1989-90 to today has vastly exceeded inflation and student population growth.


As you can see, as New Jersey increased state aid in the 1990s we first diminished and then completely eliminated pension contributions.  Thus, in discussing the origins of the Pension Crisis, the surge in state aid must be cited in addition to the sales tax cut of 1992 and Whitman's income tax cut of 1994.

Although the Education Law Center implicitly demands that New Jersey continue the pace state aid increases that occurred in the 1990s and 2000s, the pace of increase was not sustainable.

A Flatter Distribution, but Still Progressive

Aside from being a significantly lower "aid effort," state aid before the Abbott II decision had a flatter distribution than today, meaning poor towns got less and middle-class towns got more.

Yet, contrary to what is sometimes said, the pre-Abbott distribution was clearly progressive and there was already a bias in favor of "urban" districts due to the Kean Administration's attempt to give more aid to districts on the Department of Community Affairs' list of "urban municipalities."

For instance, even before the Abbott II decision came out, Newark got $263.8 million, which was more than all of Bergen County and all of non-Newark Essex combined.  Most future Abbotts got significantly less than Newark did, but they got more money than towns you might call working class and more than non-urban DFG A and B districts.

For example, in 1989-90, Millburn got $476 per student ($875 per student with inflation).  Newark got $5,519 per student ($10,155 per student with inflation), so the ratio of Millburn:Newark state aid was 1:11.  Today Millburn gets $416 per student and Newark gets $14,647, so a ratio of 1:35.

A reasonable person might consider the 1989-90 distribution to be unfair since affluent districts had vastly superior tax bases and could more than compensate for inferior state aid, but the state was still trying to give more to poor districts.


The same pattern exists for Mercer County, where state aid was progressive but flatter than it is now.


What I have never seen discussed before is that there was already a bias in favor of districts the state considered urban.


Amounts are adjusted for inflation.
The Abbotts and Everyone Else

The future Abbott districts got $1,024,840,106 in 1989-90, or 40% of the total.  At the time the Abbotts had about 24% of NJ's students.

In crafting the Abbott decisions, the NJ Supreme Court disregarded analternative aid approach to raise spending in the Abbotts up to a threshold considered "adequate."  Instead, the NJ Supreme Court said that whatever the level of the spending in the DFG I and J districts was, the Abbotts had to be at or above that level.

Since Abbott aid was tied to spending in the DFG I and J districts, the state tried to restrain spending in DFGs I and J.  Jim Florio's original Quality Education Aid of 1990 "shot the suburbs in the kneecaps" by making them pay for pensions, post-retirement health care, and deeply slashed their aid, but suburban pension assumption was reversed and the aid cuts did not (initially) go as deep as what Florio had planned.

Although DFG I and J districts gained virtually no aid, since they were not restrained from spending their own tax dollars, they were still able to increase their budgets and Abbott aid increased more than Jim Florio had wanted.

Thus, Abbott spending more than quadrupled.

First Abbott Aid doubled from $1,024,840,106 in 1989-90 to $2,291,696,951 in 1997-1998, when the Abbotts reached parity with DFG I and J districts.  During those eight years, inflation had only been 29%.

Over the next two decades to 2016-17, Abbott funding would again more than double again, to $5.1 billion (counting Pre-K).  Whereas in 1989-90, the Abbotts got 40% of the state aid total, in the 2010s they get 60% of a much larger total.

The Abbotts got the lion's share of the increase, but poor non-Abbotts did reasonably well during the 1990s.  However, after 2001-02, non-Abbott aid began a multiyear stagnation.


Aid by '90 DFG 1989-90 Aid 2016-17 Aid (counts Pre-K) Percentage Increase
Abbott $1,024,840,106 $5,097,138,421 397.36%
DFG A Non-Abbott $33,026,612 $90,616,671 174.37%
DFG B Non-Abbot $193,413,331 $651,367,836 236.78%
DFG CD $206,432,630 $588,105,998 184.89%
DFG DE $305,697,001 $793,285,540 159.50%
DFG FG $220,873,914 $488,171,679 121.02%
INFLATION 94%
DFG GH $232,498,986 $431,780,101 85.71%
DFG I $196,401,926 $273,268,931 39.14%
DFG J $9,054,787 $12,979,326 43.34%

It's critical to remember that these totals conceal great variation.  Even though DFGs A through FG appear to have gained, there are districts who have lost aid in each of those DFGs, even DFGs A and B. Lawrence Township in Cumberland County was DFG A, but it has lost aid in per pupil and inflation adjusted terms.  Lakewood was in DFG B, but it has also lost aid.

In per pupil terms and inflation-adjusted terms, a majority of NJ districts have lost aid.

Of the state's $5.54 billion increase in K-12 opex aid, the Abbotts have gotten over $4 billion, or nearly two-thirds. Counting construction aid and Pre-K aid, the Abbott increase easily exceeds two-thirds.


The Biggest Losers

I hate to use the word "loser" in the context of any district, but I can't think of another antonym for "gainer" that fits.

The biggest losers in aid per student are NOT wealthy districts like Millburn, Princeton, and Mountain Lakes.  The largest losers in state aid are districts for whom aid has been flat or negative and population growth has been dramatic.

Chesterfield is NJ's biggest loser, since its population has quintupled and its aid has actually dropped. In 1989-90, Chesterfield got $523,570 for 228 students.  For 2016-17, Chesterfield will get $419,983 for 801 students.  

 Adjusted for inflation, Chesterfield has lost 87% of its state aid ($4,225 per student in '89-90, $501 per student for '16-'17)

It's possible that Chesterfield was overaided in 1989-90, but a drop of this magnitude is unacceptable unless there has been a tremendous increase in wealth.

There are in fact about 100 districts in New Jersey that have lost aid in nominal terms and these districts are not all wealthy. Cherry Hill, is the state's biggest loser in nominal dollars. It got $18,222,828 in 1989-90. Now it gets $13,110,005.


Conclusion:

The trend of state aid increases outpacing inflation was never going to be sustainable and New Jersey has to get used to a "new normal" where state aid increases are modest and often lag inflation and student population growth.

The huge surge for the Abbotts is particularly unsustainable.  Given the ineffectiveness of Abbott spending, Abbott aid should be be redistributed to other needy districts.

----

Data Note:

The state aid amounts I got from the DOE were in a very easy to use Excel format, but the enrollment data had to be scanned in manually. Since the enrollment data is formatted in a way that is not machine-readable, I have had to hand copy the data myself. Please excuse any data entry errors and try to focus on the big picture.

Also, the state has changed how it calculates enrollment for districts that have sending-receiving relationships with high schools.  The 1989-90 enrollment numbers I got did not include send-receive kids for whom the district pays tuition, although these students counted towards state aid.  The 2016-17 enrollment figures I have do include send-receive kids.  Because the 1989-90 and 2016-17 enrollment figures for send-receive districts are calculated differently I exclude them from 1989-90/2015-16 per pupil comparisons.